Dentalfloss
Legendary member
- Messages
- 63,404
- Likes
- 3,726
dumpin nicelyp/b time
chart comin
dumpin nicelyp/b time
chart comin

posted at 5.18 pmp/b time
chart comin

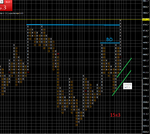
1879 hit.1879 a poss res
price is getting squeezed
excellent workMorning all, nice rise overnight.
you can see the breakout is 50% of the rise. Pump or dump from here?


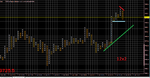
great stuffCloser in view