Dentalfloss
Legendary member
- Messages
- 63,404
- Likes
- 3,726
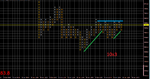
chart is really clear
you can see prev supps on that minor move up//green trendline
these should act as res
9400 prev supp
9450-9475 is 50% of move down
then 9500 area up to 9525 area
9625 a big res area
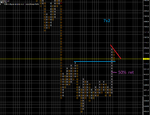
you can see prev supps on that minor move up//green trendline
these should act as res
9400 prev supp
9450-9475 is 50% of move down
then 9500 area up to 9525 area
9625 a big res area