Dentalfloss
Legendary member
- Messages
- 63,404
- Likes
- 3,726
humming nicelya decent move off trend res on spx..from chart posted
took the dax with it
humming nicelya decent move off trend res on spx..from chart posted
took the dax with it


Draghi and oil move..i thinkMorning all. What just woke the DAX up?
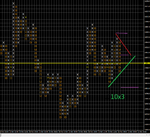
bull flag...excellent and the move off restrend is up
there is a bearish signal near the green trendline..not well defined enough to really draw a bearish res line...so coloured it purple..nevertheless it is a minor res area
Draghi speaking today
stack of overhead res
could go either way
IMHO..
could even be another bull flag
excellent:smart::smart::smart::smart::smart::smart::smart::smart:took the short from 955 stop tightened now
Closed out with 70, probably a bit early but heyho
areas posted from the close plot..hence there must be some leeway the high or low printedfrom that chart we get
10928-10944 trend res
10880-10900
supp areas
10840
down to 10800
there are plenty of areas of horizontal supp/res not shown