The Pivot point system is a technique developed by floor traders, to help ascertain where the price is relative to previous market action. It can be classified as a technical indicator derived by calculating the numerical average of the high, low and closing prices, of any currency / index / stock etc.
A look at market movement tells us that price always fluctuates between a level of support and a level of resistance. Properly identifying key support and resistance levels can improve the ability to enter, exit, and manage your trades.
The pivot point is a level at which the sentiment of the market changes. It can tell us where the sentiment of traders and investors changes, from bull to bear or vice versa.
The main advantage of this technique is that it is price-based as opposed to indicator-based. By the time most indicators generate a signal, the move is already well under way. By following this system, one can get into a trade before the indicator-following traders, and be well into the trend when a signal is just being generated on a stochastic or other oscillator.
In its basic interpretation, we can say that if the market breaks the Pivot level up, then the sentiment is said to be a bull market and it is likely to continue its way up, on the other hand if the market breaks this level down, then the sentiment is bearish, and is expected to continue its way down.
Also at this level, the market is expected to have some kind of support/resistance, and if price can't break the pivot point, a possible bounce from it is plausible.
Why do the Pivot Points work, one may ask? They work simply because many individual traders and investors use and trust them, as well as bank and institutional traders. It is known to every trader that the pivot point is an important measure of strength and weakness of any market.
Trading with pivot points is not a big secret. Floor traders and dealing desks have been applying the methodology for decades in the currency market. But what separates the profitable traders from the losers is the simple act of following the trend of the day, cutting losses short and letting profits run to the next pivot value.
Pivot points work best on highly liquid markets, like the spot currency market, but they can be used in other markets as well.
There are several different methods for calculating pivot points, the most common of which is the five-point system. This system uses the previous day's high, low and close, to derive the pivot point along with two support levels and two resistance levels (totaling five levels)
The equations are as follows:
Here, "P" represents the pivot point,
"S" the support levels,
"R" the resistance levels and
"H", "L" and "C" represent the High, Low and Close respectively.
These levels form the support and resistance levels for the current session. So what do the numbers tell us, and how do we use them for trading the price action? Let us put down, the implementations of these levels in a brief summary "
Besides the 5 point calculation used above, some other calculations are also used for the Pivot levels.
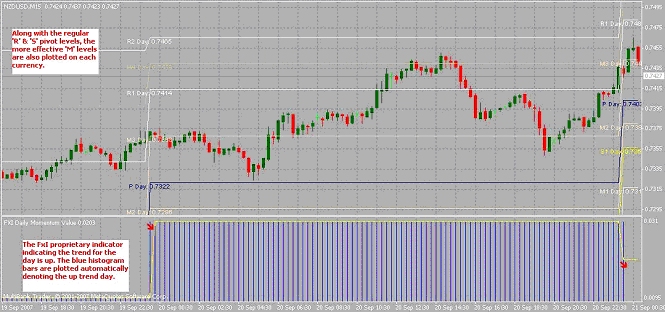
(a) There are certain "M? levels which give some additional support and resistance levels to the basic calculation. Price action, especially in the currency markets respects these levels quite frequently. This is very helpful, after a large range day when the basic support and resistance levels are far apart. And if we have to wait for price to approach a Pivot level to decide on a trade, these mid levels come in handy for entering a trade. These M levels are more useful as indications for the range of the day.
The Momentum Value Indicator.
This is a proprietary indicator developed exclusively by FxInstructor. It indicates the trend for the day very effectively, and thus gives a proper perspective for the trading day. It is very effective since it is calculated by taking into account the close, high, low and the momentum values of the previous 5 days, and thus takes a longer term move into account.
As seen in the chart example, the previoiusly mentioned "M" levels as well as the "Momentum value" indicator are plotted automatically on the charts, thus giving the trader a "map" for the day at a glance.
A look at market movement tells us that price always fluctuates between a level of support and a level of resistance. Properly identifying key support and resistance levels can improve the ability to enter, exit, and manage your trades.
The pivot point is a level at which the sentiment of the market changes. It can tell us where the sentiment of traders and investors changes, from bull to bear or vice versa.
The main advantage of this technique is that it is price-based as opposed to indicator-based. By the time most indicators generate a signal, the move is already well under way. By following this system, one can get into a trade before the indicator-following traders, and be well into the trend when a signal is just being generated on a stochastic or other oscillator.
In its basic interpretation, we can say that if the market breaks the Pivot level up, then the sentiment is said to be a bull market and it is likely to continue its way up, on the other hand if the market breaks this level down, then the sentiment is bearish, and is expected to continue its way down.
Also at this level, the market is expected to have some kind of support/resistance, and if price can't break the pivot point, a possible bounce from it is plausible.
Why do the Pivot Points work, one may ask? They work simply because many individual traders and investors use and trust them, as well as bank and institutional traders. It is known to every trader that the pivot point is an important measure of strength and weakness of any market.
Trading with pivot points is not a big secret. Floor traders and dealing desks have been applying the methodology for decades in the currency market. But what separates the profitable traders from the losers is the simple act of following the trend of the day, cutting losses short and letting profits run to the next pivot value.
Pivot points work best on highly liquid markets, like the spot currency market, but they can be used in other markets as well.
There are several different methods for calculating pivot points, the most common of which is the five-point system. This system uses the previous day's high, low and close, to derive the pivot point along with two support levels and two resistance levels (totaling five levels)
The equations are as follows:
R2 = P + (R1 - S1)
R1 = (P x 2) - L
P = (H + L + C) / 3
S1 = (P x 2) - H
S2 = P - (R1 - S1)
Here, "P" represents the pivot point,
"S" the support levels,
"R" the resistance levels and
"H", "L" and "C" represent the High, Low and Close respectively.
These levels form the support and resistance levels for the current session. So what do the numbers tell us, and how do we use them for trading the price action? Let us put down, the implementations of these levels in a brief summary "
- Pivot points can be used in two ways. The first way is for determining overall market trend: if the pivot point price is broken in an upward movement, then the market is bullish, and vice versa.
- The second method is to use pivot point price levels to enter and exit the markets. For example, a trader might put in a limit order to go long, if the price breaks a resistance level, and use a lower support level as a stop.
- The strength of support and resistance of these levels is usually determined by the number of times price has reacted at these levels. The more times the price has reached a support or resistance level, and then reversed from there, the more powerful is that level.
- These also give ideal technical levels to place protective stops, which can be placed just outside a support or resistance level.
Besides the 5 point calculation used above, some other calculations are also used for the Pivot levels.
(a) There are certain "M? levels which give some additional support and resistance levels to the basic calculation. Price action, especially in the currency markets respects these levels quite frequently. This is very helpful, after a large range day when the basic support and resistance levels are far apart. And if we have to wait for price to approach a Pivot level to decide on a trade, these mid levels come in handy for entering a trade. These M levels are more useful as indications for the range of the day.
The Momentum Value Indicator.
This is a proprietary indicator developed exclusively by FxInstructor. It indicates the trend for the day very effectively, and thus gives a proper perspective for the trading day. It is very effective since it is calculated by taking into account the close, high, low and the momentum values of the previous 5 days, and thus takes a longer term move into account.
As seen in the chart example, the previoiusly mentioned "M" levels as well as the "Momentum value" indicator are plotted automatically on the charts, thus giving the trader a "map" for the day at a glance.
Last edited by a moderator: