Pivot Points have been used by floor traders at the major equities and futures exchanges for a long time. Traders found that the price tended to hover near the pivot level and trade in between the pivot and support and resistance levels generated by a simple calculation based on the previous day's high low and close. One advantage of using Pivots is they are a predictive indicator as opposed to lagging.
Predictive Vs Lagging Indicators
The majority of technical indicators most traders use such as moving averages and RSI are lagging. Meaning they are telling us what has already happened, or at best, what is happening in real time. Few indicators are predictive; one type of predictive indicator is Pivot Point study. Pivot Points use old data to predict future price movement, and, since technical analysis is based on the idea that many people looking at the same thing will draw similar conclusions, we can use pivot points in a variety of ways to improve our trading. Traders found that by using the pivot point and the previous day's range, high and low, they could set support and resistance levels that price respected. There are several methods of calculation for these pivots and we will explore the classic calculation method in this article in detail but will also discuss the alternative methods.
Classic Pivot Points
To calculate the pivot point, take the previous day or session's high(H), low(L) and close(C), add them together and divide by 3 [(H+L+C/3 = Pivot Point (PP)] Now we can calculate the support and resistance levels based off the pivot,
S1 = (PP x 2)-H
R1 = (PP x 2) - L
S2 = (PP-Range)
S3 = (PP-Range) x 2
S4 = (PP-Range) x 3
R2 = (PP+Range)
R3 = (PP+Range x 2)
R4 = (PP+Range x 3)
Range = High-Low.
E-mini S&P500 Chart:
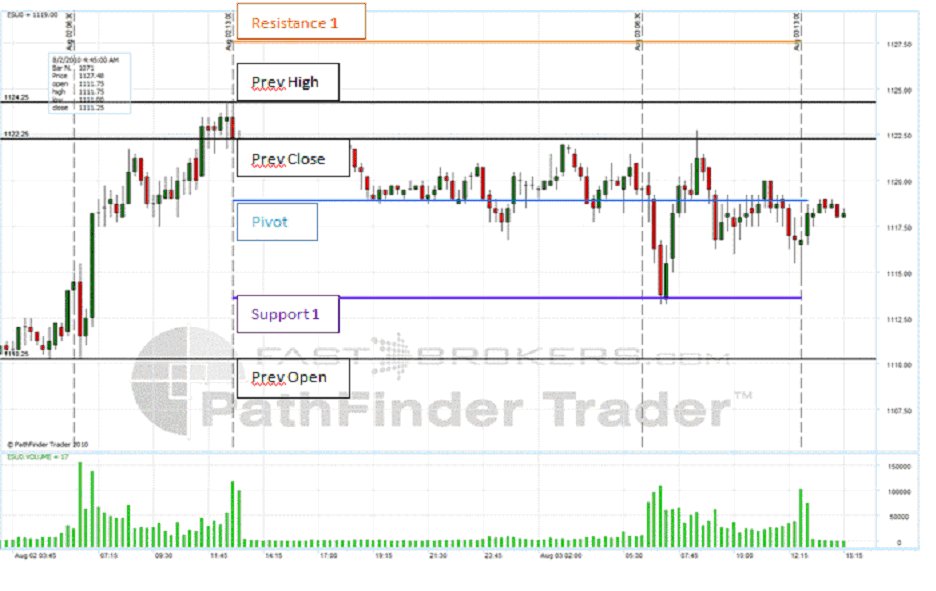
For this example we will use the E-mini S&P 500 futures.
The previous session high = 1124.25,
The low = 1110.25
Close was 1122.25
Using these values we can calculate the pivot point,
PP = 1118.92
S1 = 1113.57
R1 =1127.58
S2 = 1104.94
S3 = 1090.92
S4 = 10796.92
R2 = 1132.92
R3 = 1146.92
R4 = 1160.92.
Looking at this chart, we see that when price fell, it fell exactly to the first level of support and bounced higher. We used the exchange hours to set our session and ignored the Globex/overnight session when calculcating our pivot points. The reason we did this is because much more volume is traded during the exchange session and the institutions that really move the price are trading during these hours. Most institutions do not trade the low liquidity overnight session unless there is a news event. So when the market opened the next day it immediately fell and found support exactly at S1. The difference between R1 and S1 was about 14 points, which is a pretty large range for this contract. In other words, it would take a major event to push the price to the next level of support or resistance (S2, R2). By using S1 as the buy entry and our pivot point as a take profit level we can use S2 as the Stop Loss level, the difference between S1 and the PP was 5.34 (5.25 rounded down, which is 21 ticks on this contract), so that was our profit potential on this setup. Conversely, we could have set a buy stop slightly higher than R1 and a sell stop right below S1, this would be more of a breakout strategy where we look for the price to move through either level with momentum and continue down to S2 or move higher to R2.
Alternate Calculation Methods
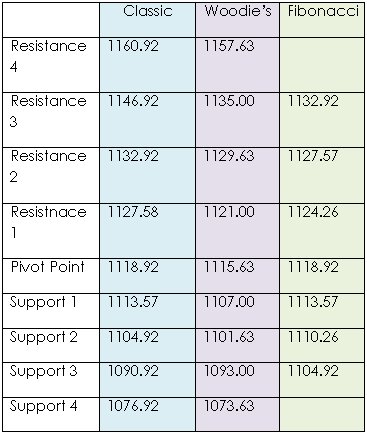
There are several methods to calculate pivot points, 2 alternate methods are Woodie's and Fibonacci. For Woodie's method instead of using the previous session's closing price, we use the current session's open price.The formula to calculate the pivot point is
PP = (H+L+(Today's Openx2)/4.
Our Support and Resistance levels are calculated the same way as the classic method. Another method is Fibonacci, this method uses the Classic calculation to find the Pivot Point of (H+L+C)/3 but uses the major fibonacci levels to calculate support and resistance levels.
S1 = PP-0.382 x (H-L)
S2 = PP-0.618 x (H-L)
S3 = PP-1.0 x (H-L)
R1 = PP+0.382 x (H-L)
R2 = PP+0.618 x (H-L)
R3 = PP+1.0 x (H-L)
Here is a table using the same Open, High , Low and Close data to compare the different calculation methods:
Combining Pivots with other tools.
Pivot Points are a valuable tool for any trader, however, no single tool tells the whole story, we are looking for multiple indicators to align and confirm a move. Meaning, if the price is nearing R1, our RSI is above 90 and we have an important Fibonnacci level at or around the same price, that validates our prediction that we will encounter resistance more than relying on any 1 indicator. It is important to look at different indicators that tell a different story. For example if you are using a moving average crossover for entry confirmed by a MACD, you are basically looking at the same thing in two different ways, a MACD measures the difference between 2 moving averages so of course the signal will be confirmed! But if we mix the inidcators up by using a momentum indicator such as RSI or Stochastics, now we are looking at 2 different instruments that are giving a similar reading. Combine these indicators with support and resistance tools such as pivots and Fibonnacci, now you have 3 totally different indicators for confirmation, that means you have a much better chance of making a good trade. You may find yourself taking less trades, however this is about quality, not quanitity. In the end, trading is all about probablilty, and if you put the probability in your favor over and over again, you will increase your chances of coming out on top.
Jesse Richards can be contacted at Fast Trading Services LLC
Predictive Vs Lagging Indicators
The majority of technical indicators most traders use such as moving averages and RSI are lagging. Meaning they are telling us what has already happened, or at best, what is happening in real time. Few indicators are predictive; one type of predictive indicator is Pivot Point study. Pivot Points use old data to predict future price movement, and, since technical analysis is based on the idea that many people looking at the same thing will draw similar conclusions, we can use pivot points in a variety of ways to improve our trading. Traders found that by using the pivot point and the previous day's range, high and low, they could set support and resistance levels that price respected. There are several methods of calculation for these pivots and we will explore the classic calculation method in this article in detail but will also discuss the alternative methods.
Classic Pivot Points
To calculate the pivot point, take the previous day or session's high(H), low(L) and close(C), add them together and divide by 3 [(H+L+C/3 = Pivot Point (PP)] Now we can calculate the support and resistance levels based off the pivot,
S1 = (PP x 2)-H
R1 = (PP x 2) - L
S2 = (PP-Range)
S3 = (PP-Range) x 2
S4 = (PP-Range) x 3
R2 = (PP+Range)
R3 = (PP+Range x 2)
R4 = (PP+Range x 3)
Range = High-Low.
E-mini S&P500 Chart:
For this example we will use the E-mini S&P 500 futures.
The previous session high = 1124.25,
The low = 1110.25
Close was 1122.25
Using these values we can calculate the pivot point,
PP = 1118.92
S1 = 1113.57
R1 =1127.58
S2 = 1104.94
S3 = 1090.92
S4 = 10796.92
R2 = 1132.92
R3 = 1146.92
R4 = 1160.92.
Looking at this chart, we see that when price fell, it fell exactly to the first level of support and bounced higher. We used the exchange hours to set our session and ignored the Globex/overnight session when calculcating our pivot points. The reason we did this is because much more volume is traded during the exchange session and the institutions that really move the price are trading during these hours. Most institutions do not trade the low liquidity overnight session unless there is a news event. So when the market opened the next day it immediately fell and found support exactly at S1. The difference between R1 and S1 was about 14 points, which is a pretty large range for this contract. In other words, it would take a major event to push the price to the next level of support or resistance (S2, R2). By using S1 as the buy entry and our pivot point as a take profit level we can use S2 as the Stop Loss level, the difference between S1 and the PP was 5.34 (5.25 rounded down, which is 21 ticks on this contract), so that was our profit potential on this setup. Conversely, we could have set a buy stop slightly higher than R1 and a sell stop right below S1, this would be more of a breakout strategy where we look for the price to move through either level with momentum and continue down to S2 or move higher to R2.
Alternate Calculation Methods
There are several methods to calculate pivot points, 2 alternate methods are Woodie's and Fibonacci. For Woodie's method instead of using the previous session's closing price, we use the current session's open price.The formula to calculate the pivot point is
PP = (H+L+(Today's Openx2)/4.
Our Support and Resistance levels are calculated the same way as the classic method. Another method is Fibonacci, this method uses the Classic calculation to find the Pivot Point of (H+L+C)/3 but uses the major fibonacci levels to calculate support and resistance levels.
S1 = PP-0.382 x (H-L)
S2 = PP-0.618 x (H-L)
S3 = PP-1.0 x (H-L)
R1 = PP+0.382 x (H-L)
R2 = PP+0.618 x (H-L)
R3 = PP+1.0 x (H-L)
Here is a table using the same Open, High , Low and Close data to compare the different calculation methods:
Combining Pivots with other tools.
Pivot Points are a valuable tool for any trader, however, no single tool tells the whole story, we are looking for multiple indicators to align and confirm a move. Meaning, if the price is nearing R1, our RSI is above 90 and we have an important Fibonnacci level at or around the same price, that validates our prediction that we will encounter resistance more than relying on any 1 indicator. It is important to look at different indicators that tell a different story. For example if you are using a moving average crossover for entry confirmed by a MACD, you are basically looking at the same thing in two different ways, a MACD measures the difference between 2 moving averages so of course the signal will be confirmed! But if we mix the inidcators up by using a momentum indicator such as RSI or Stochastics, now we are looking at 2 different instruments that are giving a similar reading. Combine these indicators with support and resistance tools such as pivots and Fibonnacci, now you have 3 totally different indicators for confirmation, that means you have a much better chance of making a good trade. You may find yourself taking less trades, however this is about quality, not quanitity. In the end, trading is all about probablilty, and if you put the probability in your favor over and over again, you will increase your chances of coming out on top.
Jesse Richards can be contacted at Fast Trading Services LLC
Last edited by a moderator: