Pivot zones can be very revealing to traders. J.T. Jackson has conducted extensive statistical research on a variety of US markets. His research has shown that traders can use daily market action to determine specific probabilities for price to trade within a certain area, and also to highlight support and resistance areas for the following day. These statistics can help enhance the quality of trading signals and (increase the "hit rate" - or number of winning trades). Additionally, these statistics offer insight into the current trend of the market and can signal the underlying strength of the trend. In the following article, this concept is applied to the Dax future, using end-of-day data for the period from 1998 to 2003.
The concept
Every trading day is divided into six zones, which are calculated by five pivot lines. On the basis of these zones, a trader can calculate the probability for price to remain within a certain area and can pinpoint support and resistance within those zones. Of particular interest are statistical evaluations of a combination of the zone of the previous close, with the zone of the following day's open. (See close-open combination.)
Calculation of the zones
In order to calculate the zone, one simply needs the high, low, and close of the previous day. The centre of the zones, or the border between zone 3 and zone 4, represents the pivot line. All other zones are based off the position of the centre line and the previous high and low.
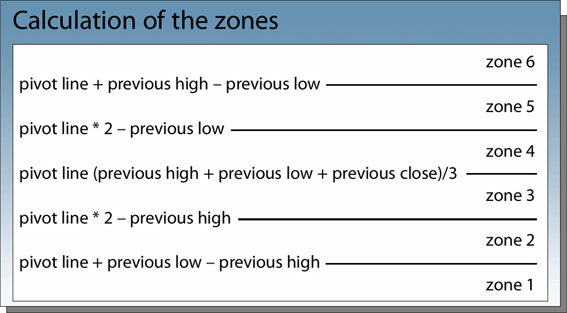
The outer zones (zone 6 and zone 1) are open; all other zones are limited on both sides.
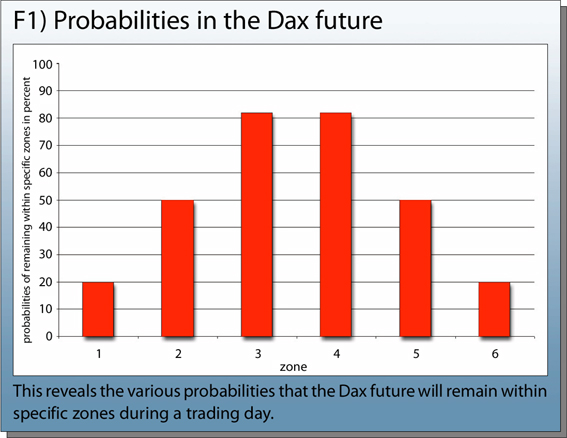
Figure 1 reveals the degree of probability that price will remain within several of these zones on any given trading day. Initially, the probabilities are distributed symmetrically and comply with the Gaussian
distribution. Generally, price remains within the centre zones 3 and 4, with an 82% probability rate. Looking at other zones, 5 and 2 are hit with a 50% probability rate and the extreme zones at 1 and 6 are hit with only a 20% probability rate during a trading day.
For every trading day, a combination of four figures can be determined, depending on which zone the open, high, low, and close occurred within. Let's look at an example in which the open occurred in zone 3, the close in zone 5, the low in zone 2, and the close in zone 4. This produces the numerical order 3524. Now, the closing zone of the previous day is added. Let's say the previous close was in zone 4, which would result in a 4-3524 reading. A close in the extreme zones represents an extremely weak session (zone 1) or conversely an extremely strong session (zone 6). A close in zones 2 or 5 reveals a weak or strong day, respectively, and a close in zone 3 or 4 generally signals a neutral session.
Trading
The close-open combinations offer particularly insightful and useful information for the trader. There are a total of 36 open-close combinations possible, from 1-1 to 6-6. A number of combinations are excluded including 1-1, 1-6, 6-1, and 6-6, because realistically they simply don't occur very often. Next, the following probabilities for the different combinations are calculated:

The open-close combinations, which revealed the most statistically significant characteristics, are seen in figure 2 and 5. Also, significant is the 3-3 open-close combination. If zone 4 is hit, the probability that resistance holds is only 33%. In this instance, a long entry on a stop is possible, as soon as price reaches zone 4. The target is zone 5. The stop would be placed below the daily low. Other trading opportunities exist as well. Zones with excessive weakness can offer trading spots. For example, the 4-3 close-open combination reveals that zone 2 is very weak and vulnerable. If zone 2 is hit, there is only a 24% probability that the market will find support. In this instance, a short entry on a stop is possible, with a target in zone 1. The stop is placed above the daily high. All other close-open combinations didn't reveal enough statistically significant characteristics during the data test in the Dax future.
A more sophisticated trading approach using the same underlying principles has been developed by Robert Krausz. He incorporated the use of Fibonacci relationships into the identification of support and resistance areas. On the basis of these bands, probabilities for several close-open combinations are calculated to determine if these bands can act as support or resistance.
Conclusion
Many trading methods are based on the fact that profitable daytrades often result in the discrepancy between the previous close and the open. With that data alone, however, one can hardly develop a reliable trading method. The myriad of possibilities of close-open combinations simply appears too infrequently. But, this information can be an extremely useful tool in combination with other technical trading approaches, including chart reading,
Stochastics, or Fibonacci retracements.
Furthermore, the continuous evaluation of the data can help gain a better overview of where the market stands and can help a trader assess the strength or weakness of a specific trading day. Finally, this technique can help traders identify useful stop-levels and profit-targets, in a systematic manner, in order to close positions more profitably.
The concept
Every trading day is divided into six zones, which are calculated by five pivot lines. On the basis of these zones, a trader can calculate the probability for price to remain within a certain area and can pinpoint support and resistance within those zones. Of particular interest are statistical evaluations of a combination of the zone of the previous close, with the zone of the following day's open. (See close-open combination.)
Calculation of the zones
In order to calculate the zone, one simply needs the high, low, and close of the previous day. The centre of the zones, or the border between zone 3 and zone 4, represents the pivot line. All other zones are based off the position of the centre line and the previous high and low.
The outer zones (zone 6 and zone 1) are open; all other zones are limited on both sides.
Figure 1 reveals the degree of probability that price will remain within several of these zones on any given trading day. Initially, the probabilities are distributed symmetrically and comply with the Gaussian
distribution. Generally, price remains within the centre zones 3 and 4, with an 82% probability rate. Looking at other zones, 5 and 2 are hit with a 50% probability rate and the extreme zones at 1 and 6 are hit with only a 20% probability rate during a trading day.
For every trading day, a combination of four figures can be determined, depending on which zone the open, high, low, and close occurred within. Let's look at an example in which the open occurred in zone 3, the close in zone 5, the low in zone 2, and the close in zone 4. This produces the numerical order 3524. Now, the closing zone of the previous day is added. Let's say the previous close was in zone 4, which would result in a 4-3524 reading. A close in the extreme zones represents an extremely weak session (zone 1) or conversely an extremely strong session (zone 6). A close in zones 2 or 5 reveals a weak or strong day, respectively, and a close in zone 3 or 4 generally signals a neutral session.
Trading
The close-open combinations offer particularly insightful and useful information for the trader. There are a total of 36 open-close combinations possible, from 1-1 to 6-6. A number of combinations are excluded including 1-1, 1-6, 6-1, and 6-6, because realistically they simply don't occur very often. Next, the following probabilities for the different combinations are calculated:
- The probability that a certain zone is reached during a trading day
- The probability that the market finds support or resistance in this zone
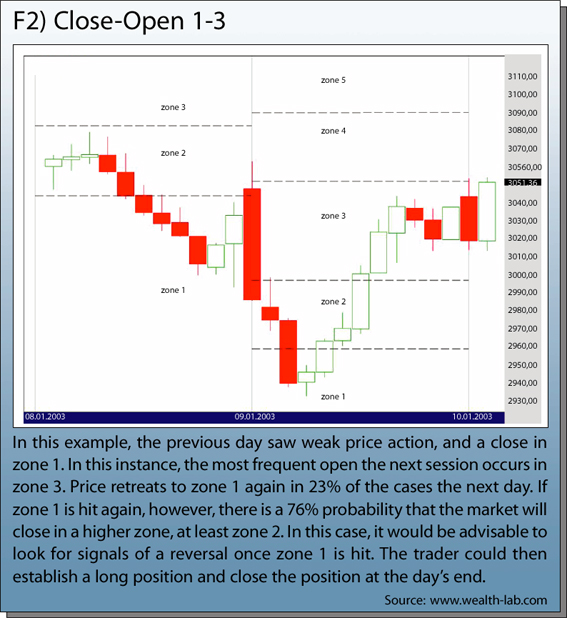
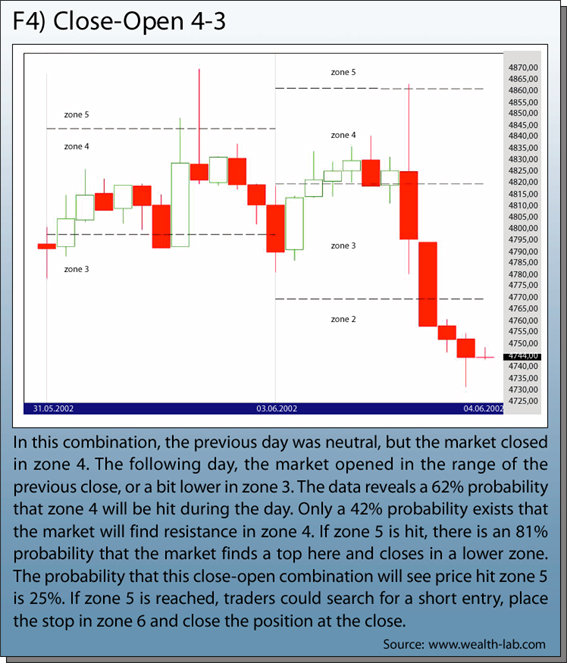
The open-close combinations, which revealed the most statistically significant characteristics, are seen in figure 2 and 5. Also, significant is the 3-3 open-close combination. If zone 4 is hit, the probability that resistance holds is only 33%. In this instance, a long entry on a stop is possible, as soon as price reaches zone 4. The target is zone 5. The stop would be placed below the daily low. Other trading opportunities exist as well. Zones with excessive weakness can offer trading spots. For example, the 4-3 close-open combination reveals that zone 2 is very weak and vulnerable. If zone 2 is hit, there is only a 24% probability that the market will find support. In this instance, a short entry on a stop is possible, with a target in zone 1. The stop is placed above the daily high. All other close-open combinations didn't reveal enough statistically significant characteristics during the data test in the Dax future.
A more sophisticated trading approach using the same underlying principles has been developed by Robert Krausz. He incorporated the use of Fibonacci relationships into the identification of support and resistance areas. On the basis of these bands, probabilities for several close-open combinations are calculated to determine if these bands can act as support or resistance.
Conclusion
Many trading methods are based on the fact that profitable daytrades often result in the discrepancy between the previous close and the open. With that data alone, however, one can hardly develop a reliable trading method. The myriad of possibilities of close-open combinations simply appears too infrequently. But, this information can be an extremely useful tool in combination with other technical trading approaches, including chart reading,
Stochastics, or Fibonacci retracements.
Furthermore, the continuous evaluation of the data can help gain a better overview of where the market stands and can help a trader assess the strength or weakness of a specific trading day. Finally, this technique can help traders identify useful stop-levels and profit-targets, in a systematic manner, in order to close positions more profitably.
Last edited by a moderator: