Jerry Olson
Well-known member
- Messages
- 363
- Likes
- 7
Andy's Market Watch - Outlook
Updated 08-Mar-2008
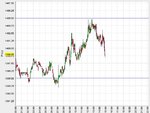
I continue to see mid-March as a low. We had a follow through in price this week making it look like the move to the low is on. There was a lot of confusing daily price action last week. But if you look at the SPX intermediate term chart below, you will see the weekly bar finished near the low and is obviously bearish.
A move to SPX 1230 would be bullish. Anything beyond that price could turn the following multi-month bull move into just an oversold rally. I see Bill McLaren has already given up on the strong move up based on his reading of price action and expects only an oversold bounce from this point. I don't see this on the SPX yet - as long we never close below 1230. I am not an E-Wave purist and would not mind an interday spike well below 1230. But reality and what I think are not synonymous and reality has beaten me every time, so far.
Assuming we stay above SPX 1230, my guess is this: The A-B-C correction between the first 5 wave cycle and the second 5 wave cycle (completed in October) lasted 218 calendar days. Whether the rally will be wave 1 of the final five wave set of the bull market or wave 4 of this correction will be determined by October. Other factors pointing to a mid-March move are:
* The 5 year cycle from the March 2003 bottom
* 50% time of October to January move
* 75% time of March to October 2007 move
* March 14th is 240 degrees from the July top on the VLE Gann emblem chart.
* March 6th is 144 degrees from the October top on the SPX Gann Emblem chart (people love that 144 number - I have not found it all that exciting...)
Looking at my public list of dynamic charts, I see the SPX attempting to complete an a-b-c off the January bottom. As long as this move stays below 1406 we can consider it wave 4 of the move down from October - with wave 5 to come into mid-March.
As always, I could be completely wrong...
Hello AJ
heck i'm from the Philly burbs so hello to a fellow Penna.
I use Point & Figure for my longer term charting set ups..
1280 SPX very solid support, any break below 1240 we go directly to 1180 the bottom of the 10 week trading band.
the bearishness out there is at historical and hysterical levels, so a bounce could happen just near the FOMC date around the 18th of March...
let's see what Monday brings us next week
good luck all
jerry