Racer
Senior member
- Messages
- 2,666
- Likes
- 30
kevinmcm said:Tropical Storm Rita "could impact 4 times as many energy rigs and platforms as Katrina and Ivan combined"
Where did you get that quote from?
kevinmcm said:Tropical Storm Rita "could impact 4 times as many energy rigs and platforms as Katrina and Ivan combined"
Racer said:Where did you get that quote from?
kevinmcm said:DJ news feed, not my own, I only see what Fins provide. The news quoted was passed to me. I saw the numbers on my nes feed but not the bit about 4 * impact
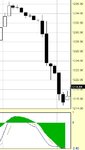
kevinmcm said:Gone long today, see a move back to test 1227 area at best. Went long DOW last night. Despite rate rise last night it is becoming clearer for the weeks ahead that the economy is less likley to improve, depends on how you interpret recent data. 1220 held, just and no more last night, was looking for it to hit 1218 when it started sliding, post Labor day holiday level.
If 1218 was taken out then there is not a lot to stop it heading nearer 1200.
So for today, my levels to watch are 1218 and take profits around 1225-27 if it heads up. Review the situation when either level is hit. Ramble over 🙂
Bitstream said:Kevin--do you trade the full contract or ES?
I think trading ES is kinda suicidal with 0.25 tick size.
On market direction I don't see the SP diving towards 1200 anytime soon, nevermind breaking it.
Joules MM1 said:I was expecting either a bounce (wave 4) witha view to a new lowfor the week or a rejection which impies an incomplete count and that we are on our way back upto (or above) 1245
Clearly we would now need to see and implusive move below todays low. Alternatively the pattern may now pick northwood steam. If there is a strong rally into the close then all downside bets are temporarily closed!
Joules MM1 said:US Events: 28th September 2005
8.30 Duarable goods orders P -4.9 F .9%
Oil Stocks P -300k
ALAN GREENSPAN, FED CHAIRMAN: History cautions that extended periods of low concerns about credit risk have invariably been followed by reversal, with an attendant fall in the prices of risky assets.
Define the EXTENT in description of the asset that is risky.