Trading the SPX

Intraday trading plan

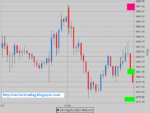
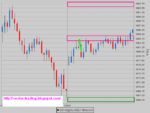
First test 898-900 area is Sell Short Daytrade, test 907-09 area is Sell Short Daytrade, test 915-17 area is Sell Short Daytrade, test 923-25 is Sell Short Daytrade, test 928-930 area is Sell Short Daytrade, trading arround and above 940p. is SHORT SELL SWING SCALING

First test 882-84 area is Buy Daytrade, test 875-77 area is Buy Daytrade, test 860-62 area is Buy Daytrade.
 

Attachments

  • ES.png
    ES.png
    35 KB · Views: 202
Sorry I missed the whole party. You've done impressive 200+ pages! :) wow...

Could you please explain what are these green and magenta thick bars are?

Support & resistance areas. The best trades, with highest probability, and highest potential for a decent reward with limited risk, are often taken from these areas.
 
Thank you. These barticular bars - are they drawn by an indcator or by hand. How do you know where they are?
 
Intraday trading Plan

Test 1.147-48 Level is Sell Short Daytrade, test 1.152-53 Level is Sell Short Daytrade.

First test 1.134-35 Level is Buy Daytrade, test 1.128-29 Level is Buy Daytrade, test 1.117-18 Level is Buy Daytrade.
 

Attachments

  • es.png
    es.png
    25.6 KB · Views: 219
Intraday trading Plan

Test 1.097-98 Level is Sell Short Daytrade, test 1.103-04 Level is Sell Short Daytrade, test 1.111-12 Level is Sell Short Daytrade.

First test 1.081-82 Level is Buy Daytrade, test 1.074-75 Level is Buy Daytrade, test 1.068-69 Level is Buy Daytrade.
 

Attachments

  • es.png
    es.png
    31 KB · Views: 199
Yeah. this is like psychoanalysis. Hang few diplomas on the wall, buy proper chair and desk, show me some stained pieces of paper, change dialog direction every time you have to answer, nod reluctanlty here and there, keep impression that you know the sacred secret of the Universe existence... There you go. £1000 per hour....

I am just curious - what exactly do you see in those spreads? Vag1na or a butterfly?
 
Hi Folks, First post here so hopefully it is a good one (y)

The S&P 500 Elliott Wave Analysis Updated from last week shows the tight range that we are trading in since hitting our 1105 target on the nose and on time.

Our timing studies were looking for an intermediate high centered on the weekend so could have come in a bit later but
when a price target and a timing target comes in together, it is always a powerful signal :)


SP-500-stock-index-0809-300x186.png
 
Last edited by a moderator:
Hi chrisw,
I can see no earthly reason why such an approach should not work as well as any other approach. Effectively the US markets trade to some degree in two halves, (it's a game of two halves :LOL: ) The morning session and the afternoon session, separated by the "lunchtime doldrums" Trading the whole day it is often useful to view the day as in efffect two separate days, you may get a move in the morning session which may see follow through in the afternoon, or may see a reversal in the afternoon. The lunchtime period characterized by relatively light volume can almost be viewed as a kind of composite of the normal pre-market / after hours session where some speculative players may position themselves for what they believe the afternoon will bring.
Hope that makes sense.

Heres a chart of the last 2 1/2 days INDU


Thanks your suggestion is good for market direction.
 
smsearsBarrons

at 10 am, $3 Billion eminis bot. just after 11 am, another $4 big ones bot. ..

twitter
 
NYSE TICK Posts Highest Intraday Low Since mid-April
By Rennie on Monday, September 20th, 2010 at 9:13 pm

NYSE TICK reflected a complete absence of sellers Monday, with the intraday low barely exceeding -800, the highest intraday low in months. An absence of large negative TICK readings is an obvious positive for the day....

ex markettells.com
 
ex smsearsBarrons

SPX 10-day realized volatility now 8.5%. Translation: options mkt very bullish on stocks. about 2 hours ago via Twitter......
 
Top