Racer
Senior member
- Messages
- 2,666
- Likes
- 30
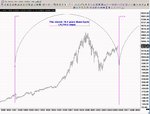
One word in a sentence I noted (my highlight for clarity), it wasn't may... or could or some other vague word.
Of course, deficits that cumulate to ever-increasing net external debt, with its attendant rise in servicing costs, cannot persist indefinitely. At some point investors will balk at further financing.
Of course, deficits that cumulate to ever-increasing net external debt, with its attendant rise in servicing costs, cannot persist indefinitely. At some point investors will balk at further financing.