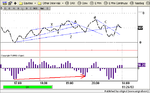
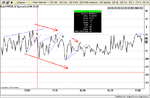
Trading the ES (E mini S&P) November 2003

Status
Not open for further replies.
Sandpiper

Todays fair value is -0.41, Now this is your anchor. If the cash deviates to far from this number, the programmes will kick in.

Just want to clarify what I expect to see if the cash or futures are leading the move.

Now the -0.41 means that the futures and cash are in equilibrium.
A sell programme is the selling of cash and the buying of futures. The sell programmes are at -1.85 and -1.24, To me this means that for today, equilibrium will be in place if the cash is 0.41 higher than the futures and if the difference rises to -1.24 and then -1.85, futures will be bought and the cash sold to bring the difference to equilibrium.

On the other hand the buy programmes are at 0.36 and 0.94. I see this as if the futures are higher than the cash by 0.36 and then 0.94, we should see the selling of futures and buying of cash.

Now I want understand the mechanics of leading and lagging cash or futures on a bull or bear day.

Bull day

On a bull day, if the the cash is leading the futures, I would need to see a number of -0.41 or lower, ie -0.41 to -1.85. However, if
the futures is leading the cash, I would need to see a figure of
-0.46 or higher, ie -0.41 to 0.94.

Bear day

On a bear day, if the cash is leading the futures, I would expect to see the cash weaker by -0.41 or more, ie to -0.41 to -1.85. However, as the cash is falling, would we not expect to see a buying of cash and a sell of futures. If the futures are leading the cash would I not expect to the futures to be weaker than cash by at least -0.41. ie to get to -0.77 (-0.41-0.36) and -1.35 (-0.41-0.94) negative swing by the futures in relation to the cash.

Anyway, I think I am getting confused now.
Andy
 
Sandpiper

Not sure what this means but at 8AM EST the PREM is at 341.Would that mean the futures are higher than by 3.41.

Cheers
Andy
 
Sand - wicked msg, many thx. brot a big smile on my face :)

Stoploss, thez no cash in the after-hours, so premium is measured off closing price.
 
lads - word of caution if u don't mind - this may be a hard session to trade. I find it hardest to trade round super-important levels (1060) on a holiday.

good lk all :)
 
Stoploss,

Your assessment of what will happen at the various levels is correct.

Bullish assessment is correct (or least that the way I view it).

Bearish assessment. Not quite there yet. Explicitly referring to your example: It should be "if the cash is leading the futures I would expect to see the futures stronger than cash by -0.41 or more, i.e. -0.41 to 0.94. Then as the cash is falling, the increasing difference between the futures and cash price will kick off a buy program (buy cash / sell futures that will close the arbitrage opportunity).

My own simplistic view of it is this: If the move is down and futures are trading above fair value, i.e. less than a -0.41 discount or at a premium (up to 0.94), I read that as the move being led by the cash market. If the move is down and the futures are trading at greater than a -0.41 discount (down to -1.85) then I read that as the move being led by the cash market.

Remember, the fair value of the futures at the moment is at a discount to the cash (mainly, but not exclusively because of interest rates).

Also, like everything, it's not 100% obviously. There are times when the futures lead the cash and guys are so desperate to get long or short that they are perfectly happy to pay more than fair value for their position (economic release bing the best example of this).

In answer to your last question: Yes futures were trading at a 3.41 point premium to the cash. In basic terms, if it stayed like this it would mean the cash would have to open up 3.82 points just to restore fair value.
 
Sandpiper

I think I am getting it, would be good if you have time, to have some snap shots during the day. I think my problem area is on down trends.

Cheers
Andy
 
EMA peak and trough analysis

China

I had another look at yesterdays rally to try and understand the market action.

X is our rising tops above the zero line. Bullish.
Y is our rising bottoms above the zero line. Bullish.
Z is our larger trend. Again bullish.

The break above the X was at the start of this rally. I think its failure to make HHs and HLs was not bearish because all it was acting out was a series of consolidations in the ES. We were also above the zero line.

A is our bull pennat.
B is our double top at the HOD in the ES.
C was a LH in the Tick EMA.

The break of the done trend line marked A, signalled that the period of consolidation was at an end and we were going to see a continued up move. B was our double top and therefore our negative Tick divergence. C putting our LH TicK EMA could be our sell trigger and the break of the line marked Z was definite shorting area.

I am trying to you the KISS principal here. There were other factors to look at apart from the Tick EMA and I am always relating what I am seeing here against what I am seeing in the ES.


Cheers
Andy
 

Attachments

  • dow 5min128.png
    dow 5min128.png
    12.2 KB · Views: 256
Interesting set up

We are fast approaching this upward trendline and beneath it is out pivot, I wonder if we get and rebounds.
 

Attachments

  • dow 5min130.png
    dow 5min130.png
    33 KB · Views: 251
Stoploss,

Can't do a snapshot at the moment for you. It's taking me all my time to keep my charts up to date with MyTrack quote delays and re-connects.

Will certainly do something like that next week when I replace it.
 
Sand

I think I have sort of sussed were you are coming from on this.

China

I think I have cracked some thing or maybe just cracked.

I will post in a mo.

Andy
 
Stoploss,

Notice where the active sell program level got hit on prem at 11:34. And notice what happened as a result.

There are other interesting things on prem but I won't be able to copy a chart over to this machine until later.
 
Peak and trough

China

Can it be this simple.

Red line was todays break down. We have LHs and finally a break of support.

Black line was todays bullish reversal. We had HLs and then a break of resistance.

Both these ema cross overs would have taken the majority of todays points.

Cheers
Andy
 

Attachments

  • dow 5min132.png
    dow 5min132.png
    14.9 KB · Views: 236
Whats this

Sandpiper

You know how I like to experiment. Anyway, what's this.
 

Attachments

  • dow 5min133.png
    dow 5min133.png
    14.1 KB · Views: 235
PREM

Done a bit of messing around with the PREM.

This is a 1 minute EMA/OHLC/4.

A, B and C correspond to three break downs. What interests me are the LHs after the trend breaks. Each time the market tanked.

They look like H&S.
 

Attachments

  • dow 5min134.png
    dow 5min134.png
    19.2 KB · Views: 239
Status
Not open for further replies.
Top