You are using an out of date browser. It may not display this or other websites correctly.
You should upgrade or use an alternative browser.
You should upgrade or use an alternative browser.
fibonelli
Experienced member
- Messages
- 1,338
- Likes
- 288
fingers crossed the price will touch 13800 in the next couple of days as i'd ideally like to exercise my option and get out of the position and get ready for wave v
Kelly
almost spot on!
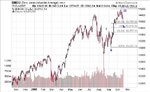
Just an update on the daily chart. My target of 13800 was hit during yesterday’s session, however I don’t think the wave iv has yet completed. As you can see on the attached chart it is around the 0.382 fib mark, however I can see the dow taking a small rise to the upside – probably today before tracking back to around the 0.50 fib possibly on Friday or Monday. This would create three sub-waves within wave iv. I would then be looking for wave v to commence during next week.
Regards
Kelly
Regards
Kelly
Attachments
Last edited:
catracho
Well-known member
- Messages
- 355
- Likes
- 34
"On the end of Wave 4, more buying sets in and the prices start to rally again.
The Wave 5 rally lacks the huge enthusiasm and strength found in the Wave 3 rally. The Wave 5 advance is caused by a small group of traders.
Although the prices make a new high above the top of Wave 3, the rate of power, or strength, inside the Wave 5 advance is very small when compared to the Wave 3 advance."
http://trading-stocks.netfirms.com/elliott-wave-analysis.htm
if the five wave move up is part of a LARGER wave 1, then we are definitely in for higher prices (next year) BUT we would have to endure a wave 2 sell off (end of this year)..pure speculation - but may tie in with the need for a DECENT correction of the move up from AUG lows?
Perhaps the count needs to be revised? As current fall enters into Wave 1 territory?
this still calls for a bullish resolution, but after a deeper pullback...
any thoughts?
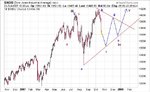
If the price ventures further down to say the 13200 mark then I agree that it is likely that another wave count may now be in force – see the attached chart. However at the current level (around 13474 at the time of writing) the original wave count still remains valid. Either way, the dow is likely to be heading north in the medium term and has given us a better than expected chance to profit from the short trade.
Regards
K3lly
Attachments
By way of an up date...
As you can see on the attached chart my original wave count has remained valid despite the big selloff that occured at the back end of last week. Therefore, the large triangle wave count on my previous post can be forgotten.....for now!! I think that the wave iv has now completed and the dow is heading for the upside on wave v - I think it is likely that this wave could last until into early 2008 and may reach highs of around 15000 before an ABC correction is observed.
To summarise I think now is a good time to go long on the dow. As always your comments are appreciated.
Regards
Kelly
Attachments
Last edited:
K3lly,
Just read this post. That was a good call - hope you did OK on the put. Good luck with the next (long call? - don't bet all your put's profit).
Grant.
Thanks Grant, i did ok with my putt - originally went for a target of 13800 but the momentum was such that I held it until the price hit the 0.50 fib (around 13600 mark) which it did last friday. I took my profit at this point, although the price then went down a further 200 points....!
Do you have any experience with elliot wave? I know a lot of traders tend to be a bit sceptical, but I think it makes a great base for a technical analysis strategy?
Kelly
Last edited:
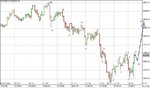
60 min chart update.
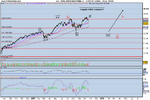
As usual I like to confirm my wave counts by looking at the 60 min chart - see attached. As you can see the wave iv was a fairly standard double zigzag connected by an x wave. I think subwave iii of wave v has now started and this itself will be constructed of 5 sub-subwaves denoted as .1 .2 .3 .4 and .5
As i think i mentioned earlier in the thread, i don't trade intraday and only use these short timeframes to confirm wave counts - so be a bit cautious if you're thinking of trying scalp a few points based on this analysis.
regards
Kelly
Attachments
Last edited:
K3lly,
For whatever reason - probably nothing more than a superficial look – I’ve never used Elliot Wave; judging from your descriptions it will take more than a cursory glance to fully appreciate.
Regarding any criticism as to its effectiveness, this applies to any indicator – some may make a fortune with one, while others lose heavily. It’s a question of knowing when it works but also when it doesn’t. And of course, the greater experience in its use, the better one can recognise ever subtle nuances, hence improved interpretation.
If your charts predict the Dow going north, can it change in an instant or does it take days to play-out or confirm change in direction?
It would be interesting if you could look at potential for intra-day/scalping.
Grant.
K3lly,
For whatever reason - probably nothing more than a superficial look – I’ve never used Elliot Wave; judging from your descriptions it will take more than a cursory glance to fully appreciate.
Regarding any criticism as to its effectiveness, this applies to any indicator – some may make a fortune with one, while others lose heavily. It’s a question of knowing when it works but also when it doesn’t. And of course, the greater experience in its use, the better one can recognise ever subtle nuances, hence improved interpretation.
If your charts predict the Dow going north, can it change in an instant or does it take days to play-out or confirm change in direction?
It would be interesting if you could look at potential for intra-day/scalping.
Grant.
Hi Grant
In answer to your question, my charts do predict that the dow has embarked on a bull market and as I don't trade on the short time frames the dirction cannot change in an instant. Instead the wave counts are revised, as in my post of last week, but the dirction usually remains broadly the same - it just takes longer to get to the target price and may take a 'different route' i.e. it could take the form of an extension, triangle etc.
The shortest time frame I use is the 60 min chart as attached to my last post. As i said i dont use this to trade off as there is too much noise - instead I'm quite happy to buy 1 sometimes 2 options contracts per month rather than spending all day looking at a screen waiting for the chance to nick a few points. When I first started trading i was really into daytrading and scalping but i ended up losing in the long run and i have since decided that longer term trading is more suited to my strategy and over the last year and a half i've done reasonable well out of the dow.
Good luck
Kelly
dick_dastardly
Established member
- Messages
- 843
- Likes
- 152
Hi Kelly
Any chance you could just clarify something for me.
With reference to the chart you posted in Post 28
...when does the wave i up complete ?
Is it on August 27th or September 4th ?
.....and
does the bottom of wave ii come in on August 28th or September 10th ?
Apologies in advance if I'm reading your chart incorrectly.
Cheers
dd
Attachments

Hi Kelly
Any chance you could just clarify something for me.
With reference to the chart you posted in Post 28
...when does the wave i up complete ?
Is it on August 27th or September 4th ?
.....and
does the bottom of wave ii come in on August 28th or September 10th ?
Apologies in advance if I'm reading your chart incorrectly.
Cheers
dd
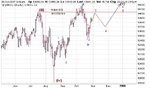
Morning DD,
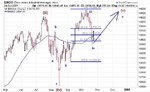
Wave i actually occurred at the end of August - I understand why you have asked this question as the top of wave i is lower than the peak that occurred during wave ii. The reason for this is that wave ii is a correctional ABC wave and in this instance it formed an 'irregular' correction whereby wave 'b' within wave ii is higher than the peak of wave i.
I have spotted an error on the chart where wave ii should have been plotted as completing in sept (where the 1.00 fib line is).
Hope the attached amended chart makes things a little clearer.
Regards
Kelly
Attachments
Last edited:
dick_dastardly
Established member
- Messages
- 843
- Likes
- 152
Hope the attached amended chart makes things a little clearer.
Regards
Kelly
Yes, that answers it.
Cheers
dd
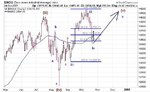
Update on the Daily chart
As you can see on the attached chart the dow has achieved some upside since my last update. I can see wave iii touching somewhere around the 14025 (local resistance) level before tracking back down to around 13810 (the 0.5% fib of wave iv). I then predict that wave v will be a long drawn out affair that could last until well into 2008.
Any comments/observations??
Kelly
Attachments
k3lly,
I have a question regarding the size of each wave.I know the 1st 3rd and 5th waves are impulsive and the 2nd and 4th waves are corrective. I also know that the third wave is the biggest wave. With regards to the 1st, 2nd, 4th and 5th waves. What order do they go in regarding size. Do you have a target for this 5th wave.
thanks,
breadman
k3lly,
I have a question regarding the size of each wave.I know the 1st 3rd and 5th waves are impulsive and the 2nd and 4th waves are corrective. I also know that the third wave is the biggest wave. With regards to the 1st, 2nd, 4th and 5th waves. What order do they go in regarding size. Do you have a target for this 5th wave.
thanks,
breadman
Hi Breadman
Now then, the third wave is not necessarily the 'biggest' but it is the most powerful ie, has the largest daily/hour/weekly price moves - I have noticed that quite often the 5th wave lasts longer in duration than the 3rd but it is less powerful. Elliot says that during this period people are a little more cautious than they were in the 3rd wave.
With the elliot wave principle you use fibs to determine wave size I also use traditional technical analysis - for example in the chart attached to the previous post i expect wave iii to terminate at the resistance line as indicated. i have a copy of an ebook somewhere that first got me into elliot wave. PM me if you want a copy.
My target for wave 5 is around 15000 which is 1.618% of wave 3.
K
Similar threads
- Article
Technical Analysis
A Beginner’s Guide to Elliot Wave Theory & Application
- Replies
- 14
- Views
- 8K