Elliot Wave theory was initiated in the 1930s by Ralph Nelson Elliot. His basic theory was that crowd behaviour, the basis for market activity, tends to operate in recognisable phases, and as such, price movements can be anticipated to some degree.
During his early studies, using Stock Market data for his analysis, Elliot isolated thirteen examples of patterns - or waves - that are repetitive in their form only, and that the time and amplitude of the waves need not necessarily be repetitive. To demonstrate what he learned, Elliot named, defined and illustrated each pattern, showing how several small patterns could be brought together to create one larger example of the same form, which would in turn merge into another, larger version of the "wave".
Elliot Wave Theory is a collection of these patterns, and a set of guidelines regarding as to where and when the patterns may occur in the financial markets. These patterns allow the Elliot Wave trader to understand market action, and possibly predict future trends. These patterns are now known throughout the industry as "The Elliot Wave Principle".
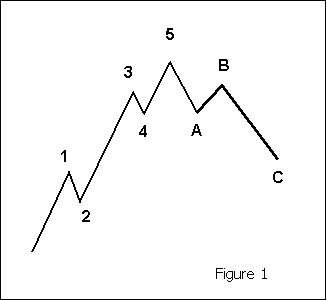
It is somewhat easier to grasp the concept of Elliot Wave if we demonstrate the theory in pictures, rather than words. The basic format is shown in Figure 1 below.

There are two distinct parts to each wave: the Numbered Phase, and the Lettered Phase.
In the Numbered Phase, Waves 1, 3 and 5 are called "impulse" waves - minor upwards moves in an otherwise bullish trend. Waves 2 and 4 are the smaller, less powerful "corrective" waves.
In the Lettered Phase, Waves A and C are the stronger impulse waves down, with Wave B - the bull wave - now the weaker move.
Waves within Waves
Elliot theorised
that the wave in Figure 1 was a small wave, embedded within an overall larger
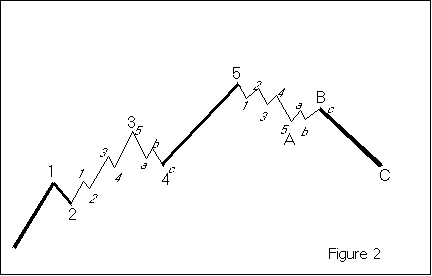
wave, and that each larger wave was in turn simply part of an even larger wave. This can be difficult to imagine, but if we look at the example in Figure 2 below, we can see exactly what he meant.

In Figure 2, we can see that Waves 1 through 5, and Waves A through C - as shown in Figure 1 - form part of an overall impulse Wave 3, as shown in Figure 2.
Elliot believed that there were many cycles of both impulse and corrective waves, and he named each cycle to fit in with his theory that the waves were based around the Fibonacci series of numbers - 1, 2, 3, 5, 8, 13 etc. The names are:
Elliot provided several varieties of the main wave, and placed particular relevance on the Fibonacci value of 0.618, as the most common level for a retracement to occur.
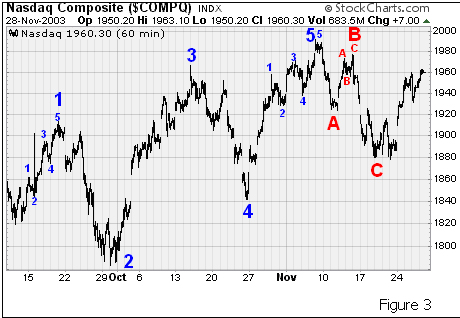
Of course, the examples shown in Figures 1 and 2 are perfect definitions of Elliot Wave Theory. In the real world, things tend not to be quite so clear. The price action shown in Figure 3 below is taken from the NASDAQ Composite Index, during the later part of 2003. The waves are still there, but somewhat harder to spot to the untrained eye.

In theory, to trade using Elliot is simple. You identify the main wave, enter long, and cover or sell short as a reversal occurs.
In practice, things can be rather different; many wave patterns are identified only with hindsight, and disagreements often arise between followers of Elliot as to which cycle the market is actually in at any given time.
This article has been merely a basic overview. Elliot Wave Theory can be explored in much more detail by those with an interest. A hot button topic among market participants, it tends to be something one either believes in or thinks is useless. The fact that Robert Prechter - probably the biggest name in Elliott Wave practice - was woefully incorrect in his public stock market predictions during the 1990s was a hit to the technique's credibility as well. It's like any other trading tool, though, in that each individual trader must determine it's value on their own. Some will find it useful. Others will not.
References:
www.elliotwave.com
www.wavechart.com
www.stockcharts.com/education Scott McCormick
During his early studies, using Stock Market data for his analysis, Elliot isolated thirteen examples of patterns - or waves - that are repetitive in their form only, and that the time and amplitude of the waves need not necessarily be repetitive. To demonstrate what he learned, Elliot named, defined and illustrated each pattern, showing how several small patterns could be brought together to create one larger example of the same form, which would in turn merge into another, larger version of the "wave".
Elliot Wave Theory is a collection of these patterns, and a set of guidelines regarding as to where and when the patterns may occur in the financial markets. These patterns allow the Elliot Wave trader to understand market action, and possibly predict future trends. These patterns are now known throughout the industry as "The Elliot Wave Principle".
It is somewhat easier to grasp the concept of Elliot Wave if we demonstrate the theory in pictures, rather than words. The basic format is shown in Figure 1 below.

There are two distinct parts to each wave: the Numbered Phase, and the Lettered Phase.
In the Numbered Phase, Waves 1, 3 and 5 are called "impulse" waves - minor upwards moves in an otherwise bullish trend. Waves 2 and 4 are the smaller, less powerful "corrective" waves.
In the Lettered Phase, Waves A and C are the stronger impulse waves down, with Wave B - the bull wave - now the weaker move.
Waves within Waves
Elliot theorised
that the wave in Figure 1 was a small wave, embedded within an overall larger
wave, and that each larger wave was in turn simply part of an even larger wave. This can be difficult to imagine, but if we look at the example in Figure 2 below, we can see exactly what he meant.

In Figure 2, we can see that Waves 1 through 5, and Waves A through C - as shown in Figure 1 - form part of an overall impulse Wave 3, as shown in Figure 2.
Elliot believed that there were many cycles of both impulse and corrective waves, and he named each cycle to fit in with his theory that the waves were based around the Fibonacci series of numbers - 1, 2, 3, 5, 8, 13 etc. The names are:
- Grand Supercycle
- Supercycle
- Cycle
- Primary
- Intermediate
- Minor
- Minute
- Minuette
- Sub-Minuette
Elliot provided several varieties of the main wave, and placed particular relevance on the Fibonacci value of 0.618, as the most common level for a retracement to occur.
Of course, the examples shown in Figures 1 and 2 are perfect definitions of Elliot Wave Theory. In the real world, things tend not to be quite so clear. The price action shown in Figure 3 below is taken from the NASDAQ Composite Index, during the later part of 2003. The waves are still there, but somewhat harder to spot to the untrained eye.

In theory, to trade using Elliot is simple. You identify the main wave, enter long, and cover or sell short as a reversal occurs.
In practice, things can be rather different; many wave patterns are identified only with hindsight, and disagreements often arise between followers of Elliot as to which cycle the market is actually in at any given time.
This article has been merely a basic overview. Elliot Wave Theory can be explored in much more detail by those with an interest. A hot button topic among market participants, it tends to be something one either believes in or thinks is useless. The fact that Robert Prechter - probably the biggest name in Elliott Wave practice - was woefully incorrect in his public stock market predictions during the 1990s was a hit to the technique's credibility as well. It's like any other trading tool, though, in that each individual trader must determine it's value on their own. Some will find it useful. Others will not.
References:
www.elliotwave.com
www.wavechart.com
www.stockcharts.com/education Scott McCormick
Last edited by a moderator:
