You are using an out of date browser. It may not display this or other websites correctly.
You should upgrade or use an alternative browser.
You should upgrade or use an alternative browser.
tablemountain
Member
- Messages
- 79
- Likes
- 1
Long candels brake sup and res
Long Dax
Sent from my iPhone using Tapatalk
OK, i'll keep that in mind based on the last pic of the 4h chart you shared and see if I can see your Long DAX play.
I got bitten badly on FTSE ydy (my bad, learnt from it) so next 3 days I'm paper trading to get my 'confidence' back shall we say.
I'll tell you what I see on DAX, lets see if it works:
Daily- From 3rd Apr I see low volume candle bars, showing slow and small short trend, some wicks both on long and short side but nothing significant, mainly I'd stick with short trend/play.
Daily- on 22nd March green thick candle bar with a wick at 1850, this is where I see the start of it going up to 12337
So I'd say next support is 1850.
Until then I'd either go short on 30 min candle bars looking for daily high or just not trade (defo not go long)
Entry at 1850 price area- I'd use a 5 min candle bar entry with bollinger bands, RSI & Stoch. When I see all on extremes, and a 5 min candle bar with a wick at bottom showing bulls pushing back up I'd get in (so it I wait for this pattern and price action confirming long, hence getting in at price area not the pirce of1850 alone, when I see bulls confirming long play I'd get in). Sometimes the candle bar just has to on extremes of bollingerbands not with a wick, and I still get in.
I'm also going to study today the DAX on daily, 4hr and 1hr charts and see if I can spot the support and res you have been showing me.
Happy trading buddy

tablemountain
Member
- Messages
- 79
- Likes
- 1

Do you see it
Sent from my iPhone using Tapatalk
yes I think I see it, I tell you what I definitely am starting to see, how 1hr chart can give better support/res price and better price action based on candle bars.
tablemountain
Member
- Messages
- 79
- Likes
- 1
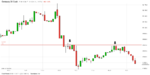
I think I can see how you use the 1 hour chart to trade. check my chart, is where I put the arrows right to indicate going short? if so, its easy for me to do it looking back, so going live how do I do it? wait for 2 or 3 bars? wait for a big wick? use an indicator?
easy for me to look at the chart historically and say 'ahh yes go short here...' but in real time, what and how is my entry?
easy for me to look at the chart historically and say 'ahh yes go short here...' but in real time, what and how is my entry?
Attachments
tablemountain
Member
- Messages
- 79
- Likes
- 1
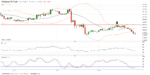
Yesterday I posted about support found on daily chart and how in mean time I would go short, I think I found a short on 1hr and 4hr chart, could use bollinger as help for entry? On 1 hour chart its on extremes on it- RSI and stoch not as helpful although stoch was curving down.
4hr chart showed 2 candle bars with wicks, but no indicators helped for entry. if on the second 4hr candle bar (12.00) you got in at the close of that bar at 12018 you would have seen it go only a little offside to 12029 and at 4pm you would have seen it at profit of 11987.
if you stay in it at 8pm you would be at 11977.
Worth the risk? or should you have waited for the long?
Attachments
Last edited:
I think I can see how you use the 1 hour chart to trade. check my chart, is where I put the arrows right to indicate going short? if so, its easy for me to do it looking back, so going live how do I do it? wait for 2 or 3 bars? wait for a big wick? use an indicator?
easy for me to look at the chart historically and say 'ahh yes go short here...' but in real time, what and how is my entry?
Yes you got it. Did you draw those two lines below the arrows? If so, you got the general idea. That top line needs to cover the start of the body of the big bearish candle.
Take a look at my previous chart and see if you get what I am trying to say.
Think of support and resistance as a large brick wall , baby candles on not going to break through. It requires a bulldozer correct? So when you see these big candles, draw your support lines and then go back and see how they hold.
Does it make sense?
Sent from my iPhone using Tapatalk

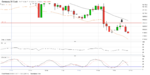
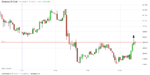
Here is an example of a forex chart. Apologies to everyone else as I know this thread was supposed to be about trading the Dax but , this important.
Look at the size of the candles that were needed to break support and resistance.
Can you explain why I went long?
Sent from my iPhone using Tapatalk
tablemountain
Member
- Messages
- 79
- Likes
- 1
Yes you got it. Did you draw those two lines below the arrows? If so, you got the general idea. That top line needs to cover the start of the body of the big bearish candle.
Take a look at my previous chart and see if you get what I am trying to say.
Think of support and resistance as a large brick wall , baby candles on not going to break through. It requires a bulldozer correct? So when you see these big candles, draw your support lines and then go back and see how they hold.
Does it make sense?
Sent from my iPhone using Tapatalk
Yes they lines were below the arrows. And yes I can see what you mean about the line being at the top of the bearish candle.
Thing I'm trying to see now is, where do I get in? at the close of these bars? If so based on what? 3 consecutive bars showing a pattern? Indicators to help confirm short? etc
Re your chart on FX- I'll take a better look later today and see if I can make sense of your sup/res
tablemountain
Member
- Messages
- 79
- Likes
- 1
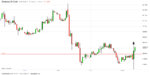
My view on DAX- support at 11850
Short until then
Yesterday I said I found a short on 4hr chart , 12 noon, get in at 12018 (close of that bar)
If you held it until 9pm would have dropped to 11962 (good profit). Personally I would have got out.
Today I'd look to short again, until 11850 support comes in. Lets see 1hr chart what its showing.
Big indecision bar with a wick at top, I wouldn't have gone short here yet until next bar to show me some confirmation of short. Lets see if I am right, it's 9.27am, at 10am and 11am will see what the bars say and if I can go short.
(or, could be an argument to wait to see if it goes to 12040 area before shorting, green bar might suggest some buying going on and wait for a better high before short)
Attachments
foroom lluzers
Veteren member
- Messages
- 3,608
- Likes
- 140
Looking for a rebound based on most stock market falls are short term , valuations are long term.
foroom lluzers
Veteren member
- Messages
- 3,608
- Likes
- 140
My view on DAX- support at 11850
Short until then
Yesterday I said I found a short on 4hr chart , 12 noon, get in at 12018 (close of that bar)
If you held it until 9pm would have dropped to 11962 (good profit). Personally I would have got out.
Today I'd look to short again, until 11850 support comes in. Lets see 1hr chart what its showing.
Big indecision bar with a wick at top, I wouldn't have gone short here yet until next bar to show me some confirmation of short. Lets see if I am right, it's 9.27am, at 10am and 11am will see what the bars say and if I can go short.
(or, could be an argument to wait to see if it goes to 12040 area before shorting, green bar might suggest some buying going on and wait for a better high before short)
long bias has 75% profit rate
http://www.trade2win.com/boards/edu...trading-system-75-hit-rate-2.html#post2892064
tablemountain
Member
- Messages
- 79
- Likes
- 1
long bias has 75% profit rate
http://www.trade2win.com/boards/edu...trading-system-75-hit-rate-2.html#post2892064
Yes I see what you are saying. I also want to go long overall but I see the support at 11850. So I'm short only until that level. If I see an entry, if not just wait for the right long play.
On 1hr chart , can see a wick a the top of candle bar, I'll see what the price action is showing at 12 noon (so the 11am candle bar) to see if confirmation of short.
I said before short maybe at 12041 area so lets see if it plays out.
Attachments

BeedyBrandy
Junior member
- Messages
- 10
- Likes
- 1
I've got a long term long position on right now. I see the tempation of a shorter term Short but I would rather take a long term view