You are using an out of date browser. It may not display this or other websites correctly.
You should upgrade or use an alternative browser.
You should upgrade or use an alternative browser.

tablemountain
Member
- Messages
- 79
- Likes
- 1
i am buying call option , 1.2100 , if price close lower ,i will buy 1.200 or 11700 next monday
i don't try to predict short term moves
Right ok got you. I dont think I can buy options on CFD account.
And in any case I am not experienced enough to start trading them. I assume it is quite costly to buy options
I will try and research tonight to see if I can understand you long plays of 1200 and 1700 on the chart
foroom lluzers
Veteren member
- Messages
- 3,608
- Likes
- 140
Right ok got you. I dont think I can buy options on CFD account.
And in any case I am not experienced enough to start trading them. I assume it is quite costly to buy options
I will try and research tonight to see if I can understand you long plays of 1200 and 1700 on the chart
next supports are 11400/11500 , 11900/11800
Last edited:
piphoe
Legendary member
- Messages
- 10,038
- Likes
- 196
next supports are 11400/11500 , 11900/11800
How about doing same thing with the dow? levels pls!

tablemountain
Member
- Messages
- 79
- Likes
- 1
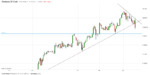
Dax hit bottom of range
Sent from my iPhone using Tapatalk
So you found a sideways range on hourly chart and went short at top of it around 12078 and came out around 1241?
how many bars until you establish a range? 3 or 4? or more? or was it that it went short so long of the day, the sideways range just showed slight indecision by traders with no real long push so indicating it would drop further?
tablemountain
Member
- Messages
- 79
- Likes
- 1
I am not using bars. Using candels those support and resistance lines based on the candles. There are no specific number of candles required. It all depends on the size and power of the candle
Sent from my iPhone using Tapatalk
yes sorry when I said bars I meant candles. was everything else i saidcorrect btw? in the way you found your short- was a dropping market, sideways meant indecision, thick red bars means selling, (thick mean strong selling as oppose to weak selling) then you go for it?
tablemountain
Member
- Messages
- 79
- Likes
- 1
tablemountain
Member
- Messages
- 79
- Likes
- 1
next supports are 11400/11500 , 11900/11800
I can see a support at 11400, but I can't see why you see support at 11500,11800 or 11900,
Can you share an image to show why these are supports?
tablemountain
Member
- Messages
- 79
- Likes
- 1

Sent from my iPhone using Tapatalk
Ok, my understanding of support- a price or price area where short selling keeps getting rejected and bulls come in and keep buying so proping up the price and not letting it fall further. Resistance where bulls try and push the price higher but again a price price area where you will see on the chart price movement upwards getting rejected and it coming back down (when it comes back down, or vice versa for support, it will go into an area with a lot of volume, so thick bars, alot of sideways bars etc.)
I notice from your chart, at the bottom the blue lines (stick res and support) that the lines have been broken with slightly with thin sticks on the candle sticks. As for the white lines above , assuming they are resistance and support, I see proper breaks of those, going right through them with thick candle bars and no 'thin wicks' on them or at least very small thin wicks.
tablemountain
Member
- Messages
- 79
- Likes
- 1

4h dax. Same story can go either way
Sent from my iPhone using Tapatalk
Ok so just 2 more questions if you dont mind;
if I am correct with my previous answer then small wicks on the candle bars will confirm price level as support or resistance
- so e.g. you 1200 has support, it gets broken by 2 consecutive 1hr candle bars to a price of say 1960 , but only broken by thin wicks, so this confirms support because thining out of sellers, the thin wicks showing twice it has tried to break and twice it is too thin and has been rejected.
- Instead in that same scenario above if you had a support of 1200, price gets broken to 1960 also but this time the 1hr candle bar that breaks it, it is a thick rectangular bar (not a wick), indicating a lot of sellers came in, even if it went to the same price, and even if it got rejected and went back up, this time the candle bar because it is thick is showing a lot of volume for sellers, or for people trying to sell. If that happened twice consecutively then you would say hang on, these thick bars show too many short sellers want to break this support,back away and wait for next level or get in short, right?
2nd question- you use longer time frames then me, so how can we justify which timeframe? 4hr? 1hr? 30 min? is it time frames which over time prove consistently profitable or is it 'industry standard' for top traders to use longer time frames?