Trading Naked - Part 2

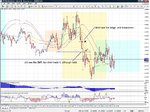
Anyone looking at cable ATM I am seeing a failure to test that 6750 level so will be looking at what price does next. A HrL and I will be looking to stop and reverse (possibly) although I have to pop out in a bit so may not be able to trade it.

N.B recent SbR level should be at 6776 not 6772 as shown on chart

Hi Rob,

I think that you mentioned before that whenever you add to a position you have to make sure that your original stop from the first trade is moved to breakeven or beyond.

Does that mean that when you got stopped for T2 that both your positions were taken out or T1 would have a different trailing stop?

I hope the question makes sense...

Thanks once again!
Leandro

PS: Let me know when you get tired of all my questions :)[/QUOTE]

Questions are good IMO as they make one think and challenge one's system :)

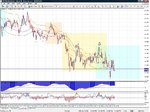
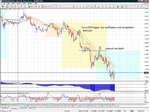
With regards to stops, T1 was at 6803 and T2 was being traded as a seperate entry so got stopped out at 6777. I then moved T1 stop down to above 6777 as this became a very important level IMO. When price broke that T1 was stopped out and I reversed into a long position. Stop now at b/e +1.

I'll try and post a chart in a while.
 
Hi Leandro,

Here's a chart which hopefully makes it a bit clearer. Just been stopped out on T3 which is a pain but that's life!!

gbpusd -  0911176 m5e.gif

All the best

Rob
 
Or dealers getting back to their desks after a quick couple of pints in the Bell (Cannon Street)!!

That would be the move about 3pm!!!

A proper pub, one of the few left, the Cannon got knocked down a few years ago and it's mainly "chain" pubs near there.

MY mates girlfriend ran it for a while, the worlds best sandwiches, more a door than a doorstep.
 
A proper pub, one of the few left, the Cannon got knocked down a few years ago and it's mainly "chain" pubs near there.

MY mates girlfriend ran it for a while, the worlds best sandwiches, more a door than a doorstep.

It was my 'local' for near on 7 years. I will always have great memories of the place - especially the night we managed to convince a colleague over from the US to try one of their pickled eggs....
 
Turning into one of those afternoons with cable today so I'm calling it a day.

gbpusd -  0911176 m5g.gif

Hope everyone else is having a good day of it.
 
sorry about indicators: :eek: (but you did ask for some indy-charts)

half sniper = 180-HMA:
AMAs, and 21-CCI, with over/under 200 as triggers into main trend. (actually, 100 would also work, but too many signals per day)

Its another pullback method!! use HMA to define trend, then use flat-lining AMA to forewarn of congestion, and/or small-bars congesting as trigger a signal.

mediocre day from GU. EU made the money today.
although I could have (coulda/woulda/shoulda) taken the EJ short of the opening range at 133.05.

EDIT: agree with KJ: tough day.

EDIT2: as per Hawktrader(ish), I am risking 20-30 pips to make 50-60. (maybe 40-50 on EU). its been a long day, as 60s havent been coming up all that much. although some 30 pippers could have been had.

EDIT3: the MACD, 3x standard settings, is a "sort-of" equivalent to PhilNels SMA Angle, but smoother. Prefer to use indicators I understand the maths of, hence its a PhilNel proxy. Almost obselete, I may as well remove it from charts.
 

Attachments

  • nov17-gu.jpg
    nov17-gu.jpg
    268 KB · Views: 153
  • nov17-ej.jpg
    nov17-ej.jpg
    248 KB · Views: 153
  • nov17-eu.jpg
    nov17-eu.jpg
    251.2 KB · Views: 149
Last edited:
HI Trendie,

Thanks for posting these charts. As you know I don't think there's anything wrong with HMA's at all!!

Am I right in thinking that your arrows respresent entries or am I missing something?

All the best

Rob
 
P.S. Am I right in thinking those little circles look like they are marking fractals?
 
HI Trendie,

Thanks for posting these charts. As you know I don't think there's anything wrong with HMA's at all!!

Am I right in thinking that your arrows respresent entries or am I missing something?

All the best

Rob

yes, arrows show entries, plus or minus 1 bar. I get an alert whenever CCI-12 (or 21) over/under 200, so I start to look for possibilities. until I get an EA written up, its a good representation of an entry.
 
P.S. Am I right in thinking those little circles look like they are marking fractals?

those are a DeMark indicator. yes, identifying highs and lows fractally. quite useful. helps to contextualise action relative to the left of chart.
they're better and less intrusive than the zig-zag. if I ever get my head around HrHs and LrLs etc, they would be the primary indicator I would use.
 
those are a DeMark indicator. yes, identifying highs and lows fractally. quite useful. helps to contextualise action relative to the left of chart.
they're better and less intrusive than the zig-zag. if I ever get my head around HrHs and LrLs etc, they would be the primary indicator I would use.

MT4 has a similar indicator
 
Trendie

Looking at your charts a lot of the entries seemed to be around the same area as most of the price action entries, is this a coincidence or do you find this most of the time?

Not a case of one working and the other not, just different ways to skin the market.
 
Trendie

Looking at your charts a lot of the entries seemed to be around the same area as most of the price action entries, is this a coincidence or do you find this most of the time?

Not a case of one working and the other not, just different ways to skin the market.

it seems to work.
since I dont trade the breakout, but the pullback, I hope to get in at bargain price, hopefully about 10-20 pips bargain. if the price I pay is to get in at PA equivalent entries, I am effectively removing the indicator lag, which is good!

ultimately, the use of indicators is so I can automate this method into an EA.
 
Good place for an order or caught in the chop?
 

Attachments

  • cable1 18-11.jpg
    cable1 18-11.jpg
    83 KB · Views: 176
overnight GU range about 60 pips. For me, that means no trend. (1.6835 / 1.6780)
So, am in breakout mode.
 
Top