Trading ES (emini S&P) - October 2003

Read this if u r a TICK trader!

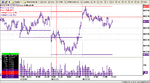
quite straighforward day with up to 14-16 pts available. If u cud only crack the midday puzzle :cheesy:

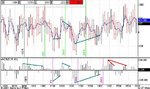
At 12:52 clear ND recorded on TICK and its momentum. I took it as a fake B/O, and reversed to short @ 1030.25. Blimey wrong - out flat. 13:28 - an even more pronounced ND, short again - out at a loss of 0.5 pts. Of coz, those WERE fake B/O but the big money was not YET legging over smaller fish on those attempts. Which led smaller fish to stage the 3rd try. U can c downward sloping res line B/O on both TICK and its momentum. Perfect chance to go long, I did not, missed out on 2-2.5 pts, but even more importantly, cud've missed out on a big move, it it had been one.

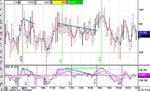
Finally comes 1034 - ND only on MACD of TICK, test of 20 ema (60 min ES) and 40 ema (5 min SOX). Tricky. The answer somes from TICK registering HOD @ above 1000 and reversing - expect SELL within 10 min. + a hint from pos time frame (see graph)
 

Attachments

  • tick2310.jpg
    tick2310.jpg
    45.5 KB · Views: 480
Stoploss,

Noted Skimbleshanks comments about the gap open trade. God, how I wish I could trade from the dark side ;). As Skim said the DT/DB were so much more obvious on the YM/DJIA. I ended up with some of the same "entries" as Skim for different reasons.

02) Traded right into the congestion area from yesterday (co-incidentally floor traders pivot as well). I liked the entry there yesterday. No reason not to like it again today. I try not to hypothesize too much as to "why" the market consolidates where it does. I just assume that there is an important impasse there and make a note for future reference.

01) Sorry about the sequencing... DB on the YM/DJIA, more significantly for me, it was a bounce off the ES opening range.

03, 04) A congestion sets up more or less the same way as yesterday. A trap below (just) a trap above (seemingly) and then rising bottoms before it breaks out for the second time upwards. (Again waiting for the second time out pays dividends, sure you miss some trades but I can cope with that). Almost forgot (kind of subconcious appraisal of some of these set-ups I suppose), the other thing going in this trades favour is the fact that there is a decent probability of getting grail buyers in both the 5m and 15m time frames helping you out. I don't use the emas for entry (and I know this thread is about trading without indicators) but I like to know where the people who do use them are likely to be.

05) Price breaks down to trade back at the base of the previous congestion without trading through it. Same as yesterday, a setup I love (simply because I know where my stop is going to be).

Won't say anything about 1034 since it's outside the focus of this thread.
 

Attachments

  • es 5m chart gif.gif
    es 5m chart gif.gif
    21 KB · Views: 519
Last edited:
CW,
thanks for analysis.Would just like to clear up VIX and VXO .Am I correct in saying that the new Vix is now based on S&P 500 Options Prices. (Previously, the original-formula VIX was based on prices of the S&P 100 (OEX) Index Options, and CBOE will continue to calculate and disseminate the original-formula index with the ticker VXO.)
Thanks again
cheers
 
no mate the other way round. VXO is based on SP500 front-end volatilities, VIX calculation is unchanged and still based on 5 puts+5 calls on OEX cash close. That was done on purpose in order to store the huge historical info that VIX has accumulated.

However, note that VIX is an untradable index, hence it is a non-speculative number. VXO can be manipulated by direct trading of VXO futures. We did not have that b4 when I was trading options on Spooz, and I can already c what games option boys r gonna play having a direct future on volatility.
 
China, on your TICK analysis you mentioned time frames, what are these based on and how are they calculated?

Thanks.

PS I thought the new VIX was now based on the SP500 and VXO was based on the old OEX :?: :confused:
 
Last edited:
eminem - rather straightforward - u take 2 pulses (highs or lows) end establish 2 anchors (-100% and 0%) and get a projection for 100% and the final push in a 3*series, which is 200%.

u also absolutely right - clear cock-up in tickers on my part. Sincere apologies! Hope this qoute from Reuters (Sep 22) will clarify the matter once and for all:

Quote:

The 10-year-old VIX has been revamped to give a better reflection of expected market volatility, the exchange said.

Starting Monday, the VIX is calculated by measuring a broader range of options on the Standard & Poor's 500 index. The original VIX was based on S&P 100 at-the-money options whose exercise prices were close to or at the current index level.

The revamping of the index also "opens the door to a new group of products based on the VIX," said Peter Dunay, chief market and options strategist with Wall Street Access.

The CBOE plans to offer futures products on the overhauled VIX starting in the fourth quarter of 2003 -- its first foray into futures. Regulatory approval for the CBOE Futures Exchange LLC came in August. Options on the VIX will be listed by the CBOE, pending regulatory approval.

CBOE's plans for VIX futures come as the exchange considers ways to regain its edge in the crowded, competitive U.S. options market.

CBOE has slipped this year to the No. 2 U.S. equity options exchange, behind New York's all-electronic International Securities Exchange, but is still the largest when index options are included.

Five exchanges are currently battling for a slice of the U.S. equity options pie, with a sixth likely to launch within months.

CBOE will keep the original-formula index and give it a new ticker symbol: VXO (^VXO - News).

end of quote
 
CW,
now i'm totally confused... I was under the impression that the old VIX was changed to incorporate SP500,thus becoming new VIX,and as a historical reference the old VIX became VOX,and thus caution was needed when comparing old historical volatility.

cheers
 
blimey....

deep sigh of relief here......

just another graph to show what I meant earlier by expanding tri on VIX. here 19 (38.2% retracement) is key
 

Attachments

  • vix2310.jpg
    vix2310.jpg
    42.1 KB · Views: 448
cupl of pts regarding TICK trading

U will find attached the TICK battle log of 24-10. Note ND at 10:55 and PD at 13:55. Both clear-cut as they involve TICK HOD or LOD (at that point in time). See also the precision of 3*push lower neg time frame. Putting on just those 2 trades alone wud rake in 20+ points.

I traded two midday TICK divs: reverse to long => reverse to short. It is important that if u traded the former pos div (without hod or lod) u stay tuned, and trade the latter one. This flipping cost me 0.5 pts but allowed to stay short for the next leg down.

VERY IMPORTANT THING: THE BEAUTY of reversing on divs is that u get a tight reference point on price - if that point is taken out , THE DIV U TRADED ON IS NEGATED!!!!! I reversed to short on both late NDs (red ones on graph) , but once price peaks were taken out, reversed to previous exposure (long). That cost me 1.5 pts, but allowed me to stay prepared for ANY CLOSE, and stay long into the close. ALWAYS WATCH THAT TIGHT STOP ON PRICE if u trade on TICK! :!:

As for the big picture, we had a major hammer on daily, key reversal and an ouside day.....
 

Attachments

  • tick2410.jpg
    tick2410.jpg
    43.4 KB · Views: 441
I thought I`d try and show a chart of yesterdays pivot S/R levels for the NQ.

It was the sort of day snake oil salesmen like Stanzione dream of :D

The 3 horizontal lines are the 3 support levels for the day. Not too shabby a day for these S/R levels :cheesy:
 

Attachments

  • nq-5min.bmp
    872.2 KB · Views: 172
NAH !

You don't need Pivots - you don't do that !

What you have shown are simply support and resistance which you would see forming bar by bar as you watch the chart unfold, followed by good old fashioned break outs/downs.

So - rather than try to forecast ! where such lines occur, simply watch them form and trade accordingly as the market unfolds.

Nothing works all the time, even breakouts; hence the need to strictly trade what you see and above all, know where your stop is - hence the use of support/resistance/consolidations as guides.

Just my `umble opinion vicar.

:cheesy:
 
Neil
as I said earlier, I`m just showing people how the pivots are doing. I never said I was trying to forecast anything, in an earlier post I stated what you have also said, that nothing works all the time.

I`m just trying to show that they do work some times,but like everything else, you need to manage the trade and your risk.

These are only entry points we`re talking about. It`s once your in the trade that really matters.

I really, truly believe that not enough people understand this, it`s only a starting point. Whether you turn a profit depends on where you get out-relative to where you got in it`s entirely possible to be profitable with any form of entry, as long as the trade is managed.

Just my two penneth worth, and hey that`s why there`s chocolate and vanilla :cheesy:
 
At the Forum

Chocolate and Vanilla.

With strawberry jam sir?

Please don't think I was getting on a high horse.

I enjoy debate and never attack anyone for their opinions even though my tongue in cheek style appears to do otherwise.

As you say, nothing works all of the time, which leaves us with money management and psychology?

The sun is quite warm here at the moment 12.55am :cool:
 
Trading the ES 27/10 to 31/10

Hi all

I'm off on my hols :cheesy: this week but here is the start of next weeks thread. Please fill it with wonderful insights that cannot be found any where else.

Have a nice week all
Andy
 
Bit late but.......

Friday's action on the ES. To pivot or not to pivot?

As I mentioned somewhere else, when there is a gap opening I favour the use of pivots calculated from both yesterdays close and todays open.

Plenty of "opportunities" even though the action felt choppy to me. Trouble is almost all of them involved trading both ways into and out of the pivot "zones".

As stevem has said, the NQ "set up" so much nicer than the ES or YM. Double bottoms on SPX, DJ, YM, ES and NQ for all the world to see were indeed too much of a convergence to ignore. I was playing for the breakdown myself but them's the breaks (ready to scratch if the S2 "zone" held twice).

Most interesting set up of the day was the long possibility at 03 on chart (conservative by a lot of peoples standards, I know). An entry that meant being long into the S1 "zone" on ES. An entry here was hard to justify in terms of risk:reward. However, offsetting this, I felt the probability of success was greater than normal.

1) Possibility of 20ema (5m) buyers on ES, YM and NQ.
2) CRUCIALLY. The time of day.
3) Support from a previous area of congestion on YM.
4) TICK.

And the rest is history.
 

Attachments

  • es 5m chart gif.gif
    es 5m chart gif.gif
    21.1 KB · Views: 410
I am a bit concerned with this bit lads:

quote:

Barron's poll is indicating that 65% of respondents now call themselves bullish or very bullish about the stock market's prospects through June 2004, up from a then-record 60% in its spring 2003 survey.
 
Trading the ES 27/10 31/10

Not done much today. Too busy faffiing about, sorting my stuff for my hols. I had a quick look at the charts. A bit on the whippy side for me. I was not sure if we were basing for an up move but I suppose the triple top signalled weakness. I would like to hear how other traders read todays action.

Cheers
Andy
 

Attachments

  • dow 5min68.png
    dow 5min68.png
    27.6 KB · Views: 373
I read it as a bull flag, with volume indicating a big boy's setup.( I learnt that from Skim). But is it right?
 

Attachments

  • big boy vol setup.gif
    big boy vol setup.gif
    22.4 KB · Views: 346
Top