Trade dissection

robster970

Veteren member
Messages
4,567
Likes
1,390
I thought I would start this thread for those who struggle to do live calls but are prepared to dissect their good, bad and average trades in public. I fall into this category.

I trade ES although I am @rsing about with EURUSD in an Spreadbetting account which might feature from time to time.

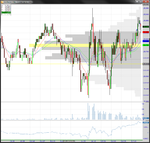
So this is my only trade for today - pretty mediocre where I decided to bail after 2 ticks.

Context for today can be found in this post - http://www.trade2win.com/boards/ind...weekly-competition-2013-a-47.html#post2083678

Areas of interest for today:
1510-1512 - Minor LVN, S/R
1496-1498 - Major LVN, S/R
1513-1514 - Minor LVN

Now it tested 1513 shortly after open but as it is a minor LVN, I did not trust to use it for entry - this is explained shortly.

What was a travesty of justice was not getting the re-test of this area around 15:55 today after it made it's high. I chose not to take it because I did not have conviction in this level holding after it tagged 1520 area and thought we were going for a re-test of 1510-1512.

My reason for this is I was expecting the value area between 1510 to 1520 to fill out a little more before attempting to move higher than 1520. I expect the LVN around 1513/1514 to be filled in over the next day or two - hence my mistrust of this level.

So I am now outside the prime 14:30-16:00 spot for trading ES. I see the following facts:

- 1513 is holding
- When the low holds you usually get a re-test of the high
- I can see it is accumulating to 18.50 - there is a shelf forming on market profile - shelves normally go....
- It looks ready to blow
- I go long with a market order at 1518.75 @ 17:42
- It goes up and seems to stall about 1519.50/1519.75
- I see few order > 30 lots going though on T&S
- I bail and take a tick for the bank and a tick to cover the costs of the trade @ 17:48

Post trade I can see it got sticky around 19.50 and has now blown through and is now gunning for the 23/25 resistance area but I like to get feedback on the trade relatively quickly and this one didn't give me enough, so I managed myself out of the trade. After a stellar day yesterday, back to reality :)

e2a - post session comment
So after tagging resistance at 1523/1525 it sold off and finally blew through 1513.75 LVN to test the 1510/1512 LVN towards the closing few minutes of the session.
 

Attachments

  • 20130228-ES-1.png
    20130228-ES-1.png
    130.5 KB · Views: 306
Last edited:
So I am going to have a go a posting some summary info leading into a trade before I take it to give it a bit more context. I don't know how regularly I am going to do this but we'll see how it goes.

Overnight, ES, 1/3

So after testing down to 1507, price has not materially moved above the S/R level 1510/1512 and the VPOC is forming right on the boundary. My view currently is that we are waiting for buyers to to show up in the European session. If buying takes it higher that 1513.75 then I think we can assume continued accumulation with 23/25 as a target again. If the buyers don't show up then sellers will take over and we're on a ride down back to 1496 area.

10:00 GMT - European session could not push ES further than 1513.50 - looks like nobody wants to trade higher than this right now, sellers have the advantage for the the meantime.

16:05 GMT - So buyers finally came in around 1500 and boy have they driven. I did not try to short around 1510/1512 even though I could have taken a couple of points off that and it is continuing to drive up. In hindsight I should have gone long once it looked like it was north of 13.75 but I didn't take that opportunity.

So that's me done for today - no trades.

One final thing to add - I mentioned in the first post and first trade this - "I expect the LVN around 1513/1514 to be filled in over the next day or two - hence my mistrust of this level."

Look what has been happening today - this area has been accepted and volume traded around and above it. The question to ask is why?

Have a good weekend folks.
 
Last edited:
A couple of questions on the first trade if I may.

You mention that it is likely to test that top given that the bottom has held. At what point did you consider that the bottom had held? 16:20 or so? Or even earlier?

You seemed to catch a bit of momentum with the entry as it had little drawdown. With yesterday's high, the overnight high, and the current daily high all around 1519/1520, were the 30+ lot trades that were going through large (cumulatively) or small relative to what you'd expect for that kind of area?
 
A couple of questions on the first trade if I may.

You mention that it is likely to test that top given that the bottom has held. At what point did you consider that the bottom had held? 16:20 or so? Or even earlier?

Probably a little earlier, shortly before 4pm - the sell orderflow just dried up, sellers were not coming through with lot sizes >30 and then buyers naturally asserted themselves. The bottom held because no more sellers were there, not because buyers stepped in aggressively.

You seemed to catch a bit of momentum with the entry as it had little drawdown. With yesterday's high, the overnight high, and the current daily high all around 1519/1520, were the 30+ lot trades that were going through large (cumulatively) or small relative to what you'd expect for that kind of area?

So the market was grinding up yesterday after the low had been put in at 16:00 - no great volume, no 1-way market but it was obvious 18.50 was defended for almost 2 hrs and that buying was occurring at higher and higher prices. Eventually when the buyers are all coming in just below the defended level, you see the limit orders getting pulled and simultaneously the order size increases so yes I was seeing volume coming through > 30 lots as it drove up through 18.50. What I did not expect was for it to get sticky at 19.50.

In the back of my mind I was balancing two probabilities:

1) When an intraday low is put in like that and the top of the initial balance is still virgin, the high of the session will get tested. This gave me a profit target of 20.50 minimum and if it drove hard through it, I would have held for 23.00.

2) Over the last 2 days, lower high and lower lows had formed - I was observing for weakness and a new lower high forming, confirming that the downward movement from the last 48hrs was not over yet.

On balance between these two scenarios, getting sticky at 19.50 warned me that it may be putting in a lower high and therefore I am trading against a newly forming trend - so watch your risk and get out.
 
Misunderstood your post, thought you had bailed because of the stall in price AND because there were some 30+lot sell orders coming in.

I suppose the question then is, given that you knew at 4pm, and you were right about the testing of the high of course, why wait until you're so close to the top and leave yourself not much room if it stalls? For me the answer to that would be that there was just no good entry in the meantime :) but I may as well ask you anyway.

It's a really good question :)

If I was trading perfectly I would have traded as you suggested; Confirmation that 13.75 was going to hold and the session high was a minimum target. However I was obviously looking for more confirmation which I got. I traded a more favourable location (13.75) for more confirmation (shelf at 18.50). There is always room for improvement and your question demonstrates that somewhere in my pea sized brain I wanted to see more strength after 2 days of selling off than it was declaring.
 
Rob, I wasn't sure if you wanted comment on this thread to start with
but as others have obviously no problem.

Just curious observation, I was wondering why you don't use tick charts?
No big deal really, time series is good enough for levels and so on if you
primarily use the tape and dom.

With a tick chart you could then use volume to get an average of number of contracts
per trade, i.e. see when the BSD's are about.
Maybe only suitable for a longer term view, especially if you place
more priority on the short term tape / dom.
Like I say no big deal, whatever works for you :)
 
I've never considered using them LV as I feel like I get enough data to work with anyway. Do you think it would be useful?

Btw, post where you like........no drama from me amigo
 
Last edited:
I've never considered using them LVN as I feel like I get enough data to work with anyway. Do you think it would be useful?

Btw, post where you like........no drama from me amigo

I dunno, only you can answer that.
Maybe try a 2000 tick (+/- 500 to taste) as a broad equivalent to m3.
As you say though, time series is OK if you only use it for levels etc.
 
Top