JTrader
Guest
- Messages
- 5,741
- Likes
- 507
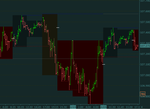
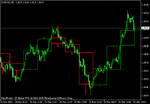
A potentially very useful, and presumably quite simple indicator that i have not seen anywhere for MT4 is one that will -
Enable you to overlay a 2nd timeframe onto a chart - eg. a weekly EURUSD chart over a daily EURUSD chart, or a daily EURUSD chart over a H4 eurusd chart.
This needn't be confusing, because you could display one timeframe as candles, and the 2nd TF as a line chart.
Such an indicator would enable the user to more easily identify things like HH-HL-LL-LH, & S/R on the timeframe above the one you are trading on, within the one chart window.
Does anyone know if an indicator like this exists for MT4, I know that other charting packages are capable of this, but not entirely sure which ones:?: What chart platforms do you know of that it is possible to do this with:?:
Cheers.
Last edited:


