You are using an out of date browser. It may not display this or other websites correctly.
You should upgrade or use an alternative browser.
You should upgrade or use an alternative browser.
Only a guesstimate, of course.... I'm not sure if there's enough Bulls to make it by Easter though.... Nice thought though, all the same. 50% in 3 months.... When was the last time that happened? Did it ever happen? The last 50% move has taken 9 months- give or take....
The best I can find is 50% over 1 year, approx.
The best I can find is 50% over 1 year, approx.
tradesmart
Experienced member
- Messages
- 1,286
- Likes
- 22
Impressive charting CM - from the above, I'm beginning to think that we may be at the dawn of a new age of bullishness........ :cheesy:
or does it have to test the lower line one more time before the dawn breaks.........?!?🙄
or does it have to test the lower line one more time before the dawn breaks.........?!?🙄
Yes, the last formation is an expanding triangle. I'm not convinced that you can call it Bull or Bear, on any chart. What you can say, according to books, is that it leads to high volatility. That should be a welcome outcome, whichever way it moves. To have a Bear outcome, it would mean going sub 6000..... To go Bull, we only have to move up a few hunderd points with a pullback to 10K ish..
tradesmart
Experienced member
- Messages
- 1,286
- Likes
- 22
Adding RSI to the longer term 5-day chart, the divergences appear to work in exactly the same way as in shorter time frames aiding the longer term position trader........
as ChartMan said, it could be an intraday chart if you ignore the numbers on the side...
judging from the current RSI setup, we may not be at a serious retracement inducing top yet, but the next few weeks could be critical imho..........
to have held a decent sized long from the March low, trading from the attached chart, would have brought a very nice Xmas bonus.....but hindsight is a wonderful thing..... 😕 :cheesy:
Attachments
tradesmart
Experienced member
- Messages
- 1,286
- Likes
- 22
Hmm……had a mixed day today and a very apt ‘New Years’ reminder that complacency is immediately punished………! 😕
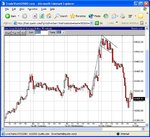
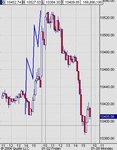
Went short at the 3-peak ND top at 10525 and held as it bounced along under the 100ma thinking it would go 90-100points on the basis that they would give the excellent ISM data news a good selling, and there was also a breach of the lower uptrend channel line that has held since November, to add to the downwards pressure.. 😎
Detected 3-peak PD at around 10432, so confidently covered short and reversed to long – WRONG MOVE! – it promptly tanked another 40 ish points, so got stopped out bigtime….. 😡
Another 3-peak PD bottom formed at around 10385 ish, so took a small long (lacking confidence now!) and closed at 10420 for 25points on the ND when it baulked at the 100ma.
Apart from a ‘selling the news’ job, I suspect that the index has reversed as it tested the top line on the multi-year 5 day chart above – plainly a very significant line, so fairly predictable I guess…!
No major data on Monday so a retest of 10500 maybe? – it seems to like double-tops and also I’ve noticed that when the good news has been sold, they like to buy it back ‘cheap’…… :cheesy:
or maybe not..... no 'dead certs' here
ps - US commentators are citing "tax related selling" on the first trading day of the new year as the reason for today's tanking, but I note that last year on the first day the index rose 265.89 points, so maybe they are talking bull......just maybe! 😉
pps - it's a calling..
"Most analysts are calling for the market to rise between 5 percent and 10 percent next year, but I think it could be more like 15 percent," said Michael Carty, principal at New Millennium Advisors. "The economy is heating up, the employment picture has been improving and companies will begin spending more."
Attachments
Last edited:
- Messages
- 2,325
- Likes
- 17
The top may soon be with us - newspapers have started the typical 'buy stocks' articles aimed at the retail buyers.
Today's Daily Mail, p6, includes the article 'It's time to buy stocks investors are urged'. Notice that this is not on the financial pages - it is early on in the main body of the newspaper, so it is aimed at the ordinary punters.
The bull market has been with us since March, and having ridden the trend nicely, I expect the big boy institutions are looking to offload millions of their longs. Difficult thing to do. Unless ... yes, of course, let the retail punters get stuck with them.
So the big boys start a bit of a PR campaign, to get all the 'investors' to believe that now is the ideal time to enter the market again. They enter, and the big boys sell them all their stock. Then the market turns. Result: big boys laughing, retail investors holding long positions bought at the top. Works a treat, every time.
The more articles which appear, the nearer we are to the top.
sandpiper
Well-known member
- Messages
- 458
- Likes
- 54
Skim,
All very true. I reckon that the UK based big boys are waiting for Channel 4 to run another series of "Show Me The Money" so that they can dump all their inflated crap on the small guys and gals.
As soon as that appears in the TV guide I'm dumping everything I've got.... 😉.
All very true. I reckon that the UK based big boys are waiting for Channel 4 to run another series of "Show Me The Money" so that they can dump all their inflated crap on the small guys and gals.
As soon as that appears in the TV guide I'm dumping everything I've got.... 😉.
- Messages
- 2,325
- Likes
- 17
Great strategy sandpiper!
If you remember that the retail investors ALWAYS get stuffed by the big boys, then you can time your market exit to perfection. :cheesy:
Actually, one of the best indicators is when every London black cabbie and every housewife is going for the company flotations hoping to make a killing. Those are the best ones, closely followed by the TV programmes.
TradeSmart and others. In case you haven't figured out why your reversal went wrong at 432...... There was a major target of 411 derived from the ND top to the middle triangle. Secondly, the PD at 432 did NOT meet the minimum time requirement of 25 mins ( 15 mins) for a bottom. At the very least, you need to wait for a higher high, or a higher low, preferably both... It's great to see so many cracking the tops and bottoms with high precision. Who needs L2.... We know where the tops and bottoms will be 15 mins before they get there! :cheesy:
Take the bottom.... 1st low 19:50... 2nd low 20:03 ( and the bells start ringing) 3rd low 20:19 and out at 20:20.
Same for the ND top- 41 minutes on each side,giving a target out time of 16:00 exactly.
I wonder how far into the 20:21 5 min bar the dark siders took to get out? :cheesy:
Take the bottom.... 1st low 19:50... 2nd low 20:03 ( and the bells start ringing) 3rd low 20:19 and out at 20:20.
Same for the ND top- 41 minutes on each side,giving a target out time of 16:00 exactly.
I wonder how far into the 20:21 5 min bar the dark siders took to get out? :cheesy:
tradesmart
Experienced member
- Messages
- 1,286
- Likes
- 22
Thanks CM - I'm getting it right most times now, but sometimes my impatience is my undoing and my New Years resolution must be to wait for that 'confirmation' higher low/high (and have a stopwatch running for the timing! :cheesy: )
Regards
Regards
CM, Not sure what u mean by the major target bit - which bit of TA does that come from, ? Can u pls explain?
TS, re the PD u went long on, I think that I might have closed too, just in case, but wouldn't have gone long 'cos it didn't look like it had 'deep' peaks and troughs.
TS, re the PD u went long on, I think that I might have closed too, just in case, but wouldn't have gone long 'cos it didn't look like it had 'deep' peaks and troughs.
From the top ND to the middle of the day triangle forms the pole. Subtract this from the end of the triangle and you get ( roughly) the target of 411. Of course, you only get it after the triangle starts it's journey to the downside, or should that be the darkside?
Beats me if I can see a big triangle from the ND to the mid tri - ah well, better get my eyes tested.
Actually, on the 5 ans 10 min charts, I think I can see a bull flag - obviously failed, but If i'd been trading 5/10 min I'd have gone long.
Anybody else concur?
Actually, on the 5 ans 10 min charts, I think I can see a bull flag - obviously failed, but If i'd been trading 5/10 min I'd have gone long.
Anybody else concur?
Attachments
- Messages
- 2,325
- Likes
- 17
aha - thx Skim - a dbl top too - guess those two things outweighed the bull flag.
Guess I'd better start reading up on elliot wave bascs too - have always stayed away from it 'cos it was too complicated and most 'experts' seemed to retrofit .......
cheers
Guess I'd better start reading up on elliot wave bascs too - have always stayed away from it 'cos it was too complicated and most 'experts' seemed to retrofit .......
cheers
- Messages
- 2,325
- Likes
- 17
I posted the only things I believe you need to know about Elliotts on the 'No Indicators' Revisited thread - the only one I look out for is the 5-wave up/down because it is simple to see.