This week's DOW 19/11-23/11

ChartMan

Legendary member
Messages
5,580
Likes
47
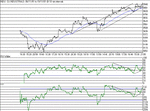
Good start! Friday I suggested the weakness seen in the prior days was a pause/consolidation and so it has turned out to be.The major turing point of 9900 turned out to be the case, with a slip and retest just below that(9885) during the day.It looked a failure at that point with RSI at 30 and CCI 128, and you would have been forgiven for thinking just that, having twice tested 9900 with little confidence. BUT the market thought different and off we went, all the way to 9976, HOD. The action continues to follow the 100MA , and the 100MA is tracking the uptend slope.
Some important things today: There was very little action around the 100MA. It formed support, then resistance and then finally support again.Crucially, the 100MA was broken swifly on the first rise off 9885, when it as at 9902, right on the 9900 support.( 1 min chart). At this point RSI was 58 and CCI had risen steeply from -95 to +2. These steep rises frequently precede substantial rallies.
Secondly, and unusually, the RSI/CCI strength is excellent in ALL time frames at the close and all trending up. ( 1 min to 1 hr.)

Thirdly,at a quick guess, IF the last few days is going to make a 5 wave Elliot up cycle, then my target of 10,200/300, is completely within reach, based losely on 150 points up, 50 points retrace = 100 point net from the base at 9800.
Current EOD uptrend resistance line is at 10,025
10 min 100 MA is at 9884
10 min support 9880/9900 strong,9950 weak
Horizontal EOD resistance 10,050/75 then 10,240
I guess tomorrow is UP , I suggest to 10,025/50, then a retrace to 10K and then on..... :)
 

Attachments

  • dow191101.gif
    dow191101.gif
    13.6 KB · Views: 472
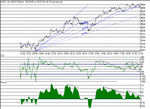
Should have kept my big mouth shut:( Just goes to show how overconfidence can bite you badly.Down to support and a double bottom, up to test resistance yet again, and a drop to close near support at 9901.If nothing else, 9975 is building in strength, in the same way that 9880/9900 did.That has been the saving grace. I really thought that when the second rally came, breaking through the 100MA, I thoughtwe were off. There is a glimmer of hope for tomorrow,there being positive divergence in the TA indicators for the last 40 minutes of trading. As I mentioned last week,there was a "rolling top" forming - this is now even more evident. Maybe I should try and find my "Bear" hat....
100mA at 9914, Support still 9880/9900, Resistance still 9975.
No more preditions :)
Just for a change, I have shown the Phase plot showing overall negative divergence, and a Fibonnaci Fan on the price plot.....
 

Attachments

  • dow201101.gif
    dow201101.gif
    15.4 KB · Views: 408
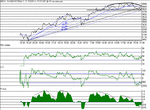
The down theory gathered momentum today, with a straight rally down to the old support at 9816,which was to be tested several times throughout the day.A quick dip below to 9800 found displeasure and rallied to 9850, only to test 9800 again. Final close at 9834. Most of the day was spent under the 100MA, briefly breaking on the rally to 9850, and finally, 30 mins before the close.On the 10 Min chart, we are still well under the 100MA, currently at 9863.Worst case uptrend support is now well broken, but the Fib. Fan is coming into play at 9780.
The rounded top is continuing to form,and a fall below current support of 9800 will no doubt complete the formation,before a collapse. Pivotal point tomorrow then will be 9800.

Support-
9750 min
9700
9550

Resistance:
9896

Fib retracements from the peak of 9975 to the low at 9039...
82% 9805....where we're at now.
62% 9616
50% 9503
38% 9393
Tomorrow will be a "half day" so expect the unexpected!
 

Attachments

  • dow211101.gif
    dow211101.gif
    14.8 KB · Views: 423
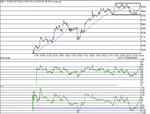
Who says half days are bad days? Bang goes that theory- well for the US anyway. The FTSE tanks and the DOW flies- against all odds.Open to close, straight up, strong finish, leaving the week down just 17. We never even looked like coming close to the pivotal 9800. Clear support and resistance now defined, offering good, safe swing trading between the rails, and solid stops on offer.Easy trade today, with RSI/CCI opening at 61/115, and not dropping below 50/00 for the whole session ( 1 min chart).
The rounded top has been broken, and the 100MA is at 9878. The general indicators are close to their peaks, showing validity for the rise, with no negative divergence in sight.
Shall I go for the rise next week, or take the contrarian view on the indicators? EOD would have to be down, even though the price is above the 7D MA.
Either way, as I said earlier in the week, this 9975 is strong, and it will take some poke to get it above, but when it does( fake exepting) it should stay there. 9800 stays as solid support.
You may argue that there is a Head and shoulders forming. I haven't ever seen one with three peaks in the middle.....two maybe...
I'll update this weekend when I get the volume data...
 

Attachments

  • dow231101.gif
    dow231101.gif
    13.5 KB · Views: 398
I dont trust today's rally, CM..it was on very thin volume and I usually find such rises unreliable, it may end up in disappointment: "Market breadth was positive Friday in extremely light trading. Advancers edged decliners by nearly 3-to-1 on the New York Stock Exchange as 410 million shares changed hands. Nasdaq advancers led decliners by more than a 2-to-1 margin as 584 million shares traded."

Riz
 
Top