fxstrategist
Established member
- Messages
- 603
- Likes
- 17
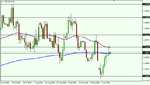
The USD/CAD has been in a well-defined bearish channel on the daily chart. The price is currently visiting the upper boundary of the channel around the 1.3100 level. In case of a bearish bounce, the 1.3000 level may act as support, but a better support could be the 200 day EMA zone around the 1.2926 level, which coincides with the 55 week EMA. In case of a bullish breakout above the 1.3100 level, the 1.3200 could act as resistance, but a better resistance could be the 1.3387 peak.