The Mighty Pinbar Humbled!

Pazienza

Senior member
Messages
2,334
Likes
442
Actually, I'm a big fan of pins. I've learnt though that (the way I do it at least) they're only good if I'm very, very sniffy about them, and insist on the best. Right up to strong closes - and yes, I am aware that this is random. Doesn't matter.

Anyway, they often still have significance even if you don't want to take them in the usual sense, as a reversal. In fact, I fade them more often than I take them in the conventional manner.

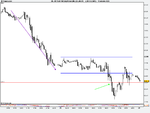
This isn't a great example in terms of outcome, but it illustrates one of the ways that I do this. I find this to be a really good scenario. Trend, range, break of the pin as a trend continuation trigger, or rather breakout trend continuation trigger. Very reliable (again, at least the way that I do it).

This one should have been a break even, but I couldn't babysit it due to work commitments, so I just closed out for about +0.35R when I had to leave the computer. Turned out to be a good thing, because had I been allowed a free hand this afternoon I would have held at break even and made nothing on it. I find I do a lot better with market just holding on, because it trends really well on an intraday level. The chart might be of interest to newer people, just to show how simple trading can be.
 

Attachments

  • US Tech 100 Daily Future (Ma (20-JAN-11).png
    US Tech 100 Daily Future (Ma (20-JAN-11).png
    15.4 KB · Views: 340
look out - it's a trap !

I think delta/tape can be very useful on traps like this. The more people that go long at that point, the more people you will have selling when the reversal fails.
 
look out - it's a trap !

I think delta/tape can be very useful on traps like this. The more people that go long at that point, the more people you will have selling when the reversal fails.

Exactly, which is one of the reasons I like fading them. Even if it isn't ultimately going anywhere, the market dynamic means most of the time I can put myself in a safe position, or at least cut out a lot of risk. You've got the people selling below the range, and as you say you've got all the people that got in long and are now wishing they hadn't. Plenty of people suckered in, plenty of longs yelping with pain, plenty of sweet downward pressure.

I really must look into the order book side of things, because I really know nothing about it. It's just a lot of flashing number isn't it :p? Are there any good introductory books you could recommend?

And you really should start checking out NQ. Look how smoothly it glides - it makes ES look like an unruly beast. :)
 
Do you find that some time frames work better than others? It must help if everyone is looking at the same time frame I imagine.
 
Pazienza - you probably don't need order flow for this - a delta (market buys - market sells) would probably do.

I can't look at NQ, that would be 'unfaithful'
 
Do you find that some time frames work better than others? It must help if everyone is looking at the same time frame I imagine.

They do work well on the daily charts, but not so well on shorter time frames.......
 
Do you find that some time frames work better than others? It must help if everyone is looking at the same time frame I imagine.

Well, I think it's really to do with the principles involved more than anything. There are absolute differences in my opinion, but I see different time frames more as the same thing but on a different scale, if that makes sense. So I would say this kind of thing is applicable to any time frame.

That said, the way I like to approach things I've found 15 minute is ideal. I do use 5 minute charts as well, but on that I am ultra choosy and everything really does have to be perfect for me to want to get involved.

Assuming you're already an experienced day trader, I'd start with 15 minute charts. It's all opinion though and what suits your own quirks - I know someone who trades using the same methods and he's the opposite; mostly 5 minute with the occasional 15 minute if something irresistible comes along.

The most important element in making this work though is the ability to wait for good set ups - this is not one for the action junkies.

It's worth experimenting with tick charts as well - sometimes you get a very different perspective on the action. You really need to do some trial and error to find a good number.
 
They do work well on the daily charts, but not so well on shorter time frames.......

So there you go, two people, two different opinions. My experience has been different to yours, although I agree by the way that this approach can be very useful on daily. Personally, I just struggle with higher time frames because of my temperament.

But it's really just simple stuff, interpreting the buying and selling, looking at the patterns it creates, and seeing what pointers it can give you. I think this mindset can be a useful addition for anyone, no matter how you trade.
 
Pazienza - you probably don't need order flow for this - a delta (market buys - market sells) would probably do.

I can't look at NQ, that would be 'unfaithful'

Thanks, I will bear that in mind. Anything at all is a change for me - at present literally all I have is the chart as you see it, and a note of when the major announcements are.

I must be a complete tart by the way - I chase S&P, Nasdaq, Dow and Russell :D.
 
Thanks, I will bear that in mind. Anything at all is a change for me - at present literally all I have is the chart as you see it, and a note of when the major announcements are.

I must be a complete tart by the way - I chase S&P, Nasdaq, Dow and Russell :D.

They are all of the same church. I use NQ and YM as confirmation/non-confirmation for ES trades.
 
"occasionally" meaning every time the market is quiet or "occasionally" meaning once a month! :eek:

Must resist the websites during market hours! :eek:
 
So there you go, two people, two different opinions. My experience has been different to yours, although I agree by the way that this approach can be very useful on daily. Personally, I just struggle with higher time frames because of my temperament.

But it's really just simple stuff, interpreting the buying and selling, looking at the patterns it creates, and seeing what pointers it can give you. I think this mindset can be a useful addition for anyone, no matter how you trade.

This guy trades on 5 minute and fifteen minute time frames. Also look at posts by "Ryanmcd" in Jankones thread who also trades lower time frames. I am not recommending theses people- simply giving you some more info on use of pinbars. Enjoy:)
http://www.forexfactory.com/showthread.php?t=163972
 
I kept wondering wondering what pin bars were. So basically it's just a tall shadow/long tail on a SH/SL?
Or am I missing something?
 
Iota, you are missing a story behind it, it is a market rejection of a certain price. If there is a bearish pin (nose up) and position on the top of the hill, then buyers started to close their positions and more and more sellers are coming in. It is very reliable on longer time frames - but it has to brake, price has to slide under the pin. SL is usually size of the pin + a bit more. Its position is very important, also its length. Thread on FF forum is very good.

I am not sure why Pazienza went long there (if he went long at the green arrow). This pin newer broke but it continued South. But look at the pin at the bottom, this is the one you suppose to take. This would also be an 1H pin probably. In this case entry for 1H pin would basically be the same as Pazienza's or a bit sooner. You can do it without MACD, just plain Price Action.

But take into considerations peculiarities of a fx pair or whatever you are trading. For GBPJPY 1H I usually let the price slide under the bearish pin at least 18 pips before going short. Because until there price often change the direction. Other fx pairs might need different approach (less pips to break).
 
Last edited:
So there you go, two people, two different opinions. My experience has been different to yours, although I agree by the way that this approach can be very useful on daily. Personally, I just struggle with higher time frames because of my temperament.

But it's really just simple stuff, interpreting the buying and selling, looking at the patterns it creates, and seeing what pointers it can give you. I think this mindset can be a useful addition for anyone, no matter how you trade.

I think he's just saying that pinbars tend to work better on higher timeframes as opposed to lower timeframes, which i think is true. Long off a hanging man, short off a shooting star.

For example, plus an inside daily bar breakout to add to the position.
 

Attachments

  • Pinbar.png
    Pinbar.png
    39.4 KB · Views: 135
  • InsideBarBreakout.png
    InsideBarBreakout.png
    45.6 KB · Views: 117
Last edited:
Do you find that some time frames work better than others? It must help if everyone is looking at the same time frame I imagine.

I look at what happens with , what someone I read once called, a mirror. A bar that does not look like a pin on, ie. a 5M TF, in fact could be a solid red bar on one bar and be solid blue on the next, making it a pin on a 10M TF.

I hope that that makes sense.
 
I am not sure why Pazienza went long there (if he went long at the green arrow). This pin newer broke but it continued South. But look at the pin at the bottom, this is the one you suppose to take. This would also be an 1H pin probably. In this case entry for 1H pin would basically be the same as Pazienza's or a bit sooner. You can do it without MACD, just plain Price Action.

Hi Ping,

I didn't go long there, I went short. That's the point of my post - people look at set ups in a very one dimensional way. I take far more trades fading reversal set ups than playing them in the normal way.

Be careful with bars like the one at the bottom - they work sometimes, but that is a classic trap bar that takes people's money time and again. There's nothing there (in my opinion) that gives you any reason to go long. It's just a very small, crappy bar with no supporting factors - no "story" as you put it at the start of your post.

To me, it looks like a hindsight trade, and I was never able to make it work whilst I took bars like that.
 
I look at what happens with , what someone I read once called, a mirror. A bar that does not look like a pin on, ie. a 5M TF, in fact could be a solid red bar on one bar and be solid blue on the next, making it a pin on a 10M TF.

I hope that that makes sense.

Yes, you can construct them any way you choose - it is just an aggregation of data. The price action is still the same however it is displayed. For example, what would a head and shoulders pattern be if you displayed it as a single bar?
 
Top