Technical Analysis The Illusion of Traded Prices

There has long been debate about price data and what kind of data are most appropriate for market analysis and reference. Much of that discussion revolves around traded price vs. indicative price. The former is the actual price at which a transaction is executed, while the latter uses the bid/offer as the basis for price series.

In the stock market, and most exchange-based markets, much of what is presented to the public is the last traded price. When one looks at the stock tables in the paper, or at the quotes presented on many screens, that is what they see. In many cases, this presents a fair representation of the market. The widely known and understood exception is thinly traded markets where the instrument in question (stock, bond, option, etc.) has not actually transacted in quite some time while prices (in the form of the bid/offer) have moved. Options, in particular, are notorious for this sort of thing. Because many of them trade relatively infrequently, the last traded price often has very little bearing on where the market currently is valuing the option.

A recent question posed on a discussion board brought up something else traders of lightly active instruments need to consider when looking at prices. The inquirer posted the following screen shot:

image1-57.jpg


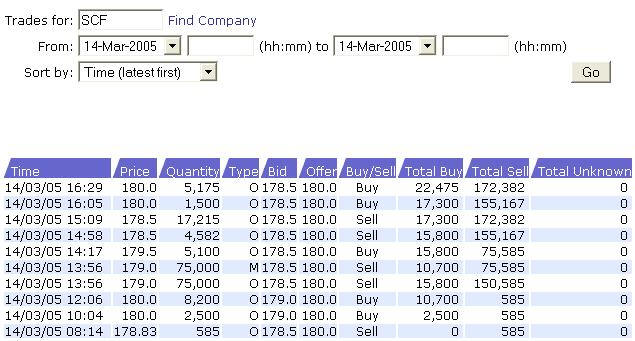
The question asked was "How come the market moved up when so much of the volume was on the sell side?" The trader was referring to the fact that the market started the day with a trade at 178.83 and ended at 180.0, but Total Sell volume was nearly 8 times Total Buy volume. It's an interesting question, but had the trader looked closely, he would have observed something important.

Refer to the Bid and Offer columns. Notice that at no point does the Offer vary from 180.0. Notice also that the Bid only changes from 178.5 to 179.0 for two trades before reverting back. This means that while the traded price varies between 178.50 and 180.0, the market actually never moved. All the action which took place did so through sales being made at the bid and purchases getting executed at the offer. It just so happens that the last trade of the day was a buy, which took place at the offer price. That produced a closing price for the day of 180.0, making the market look like it moved from the 178.83 opening price when in fact it didn't go anywhere.

Of course, one can interpret the fact that the massive overbalance in selling volume as compared to buying volume did not move the bid lower as an indication of strength. That, however, is a topic for another discussion. The point here is that when one is trading low activity instruments, one needs to be especially conscious of the real market internals and cannot just count on price to tell the full and true story.
 
Last edited by a moderator:
Although price does not "lie", price alone often does not give a true picture of what is really happening in the market and it can be necessary to dig a little deeper into the action to obtain a detailed view of capital flow. John's article briefly addresses this conundrum with a real-world example.
 
Yes, agreed. However what conclusions can be derived from what he illustrates?

This time I am keeping my mouth firmly shut, and not answering, so as not to spoil the puzzle.

This time, (which does not often happen) I have chosen to ask a question instead, above.

I am interested to see what anwers may be forthcoming.....and from whom....
 
Last edited:
I think John gives a good example of how there is more going on in the market than appears at first sight and that it is necessary to look beyond price and try to discern the 'intent' of the market participants.

Regards,
 
SOCRATES said:
Yes, agreed. However what conclusions can be derived from what he illustrates?

This time I am keeping my mouth firmly shut, and not answering, so as not to spoil the puzzle.

This time, (which does not often happen) I have chosen to ask a question instead, above.

I am interested to see what anwers may be forthcoming.....and from whom....

Without knowing more than what the example provides, I would consider the implications bullish, or at least a really good indicaiton of support. Despite all the selling activity, the bid held firm.

Is that the sort of conclusion you're looking for? Or were you angling in another direction?
 
Hello John, the idea is that in here we know. We are also interested to know who else truly knows.

Kind Regards.
 
Rhody Trader said:
So I spolied the fun, eh? :D
No, not at all, your answer is not exactly off the wall, but we are waiting here for two contrasts.

Those who really know, and those who think they know but know very little.

You could say it is a sort of covert talent contest. <G>.

I have a bet with this lot in here, that the best answers are sure to arrive by PM.

You cannot blame the experts for not wanting to let cats out of bags, outside the jungle telegraph system.

Kind Regards.
 
There seem to be two types of transaction: those that go through on the bid and offer, probably straight up buying or selling by paper, and those mysterious ones that go through between the bid and offer, in the fourth, fifth and sixth row up.

This leads me to believe that the buy/sell, total buy and total sell columns are actually misleading and possibly inaccurate. The figures do not add up and I'm not sure there is sufficient information to be able to tell what is actually going on. The two blocks of 75k look especially suspicious and may be buys disguised as sells or something equally covert. :confused:
 
frugi said:
There seem to be two types of transaction: those that go through on the bid and offer, probably straight up buying or selling by paper, and those mysterious ones that go through between the bid and offer, in the fourth, fifth and sixth row up.

This leads me to believe that the buy/sell, total buy and total sell columns are actually misleading and possibly inaccurate. The figures do not add up and I'm not sure there is sufficient information to be able to tell what is actually going on. The two blocks of 75k look especially suspicious and may be buys disguised as sells or something equally covert. :confused:

Small caps, ones with smal NMS have different reporting rules so the trades can be delayed by an hour or days, so the buys v sells can be completely misleading and reported incorrectly
 
I drew myself a picture, and there is so much "missing" information that it seems that anything I say will be clouded by all I do not know. Here is what we do know. The software classified it as a sell, because it was closer to the bid than the ask, but whether that trade was delayed, or a private deal, or whatever, - there are at least two parties (the buyer and the seller) very interested in this stock. So huge volume printed at a dollar off the high price, and for the next three hours, there was no panic, no sell off, and the price drifted back up to end the day at the high.

I don't think there is enough information to enter any trade, but if someone forced me to choose buy or sell now, based only upon what I know, I'd sigh and say buy.

JO
 

Attachments

  • priceIllusion.gif
    priceIllusion.gif
    8.8 KB · Views: 429
This has liquidity that is too poor to trade at all. If, for example, you entered this trade and things went wrong how would you exit with such low volume without taking a massive loss ?


Paul
 
Trader333 said:
This has liquidity that is too poor to trade at all. If, for example, you entered this trade and things went wrong how would you exit with such low volume without taking a massive loss ?


Paul
Agreed, (that's what I meant by "forced me to choose"- I meant with a gun to my head :eek: It seems to me that the best choice is obviously to stay away!). I'm curious about why the author used an instrument that most traders would avoid as the example for his article.
JO
 
I've just realised that I am 'the trader' referred to in this article. Well, I'm not trading actively just yet, but I may have solved this particular puzzle nonetheless.

I've had a closer look at the image in question. What may have happened is this:

Some market maker (probably in a rush to get to the nearest wine bar) keys in a sell of 75000, then realises that this is in fact a mistake and puts through an electronic note to correct this (the 75000 with an 'M' under 'Type'). The system calculating the cumulative volume does not register this, however, and merely sees two sells at 75000, equalling 150000. If this is the case, the true volume on the sell side is in fact 22382, which is now slightly less than the buy side.

It's all been a cockup, basically.
 
ivorm said:
I think John gives a good example of how there is more going on in the market than appears at first sight and that it is necessary to look beyond price and try to discern the 'intent' of the market participants.

Regards,

The intent of market participants is fully reflected in prices and there is nothing else going on in the markets. If prcies go up, buyers conceded to higher sell offers. If prices fall, sellers conceded to lower buy offers. There is no magic.

Alexander
 
Why dont we re tackle this thread "The Illusion of Traded Prices "
But this time, let us add the covenant that the market must be highly liquid at all times.
I am sure that a great deal of info can be extracted from the Trading members.

To be honest I quickly read the article and dismissed it as a waste of time ... ego driven
Prime example of useless clutter, but clearly demonstrating how difficult it is to sort the wheat from the chaff when first starting out.
 
james6848 said:
Well I'm one of those starting out, so (in the words of Delia Smith) let's be havin' you!..

James James James
Do I have to do all the work in this beautiful relationship.
It is your turn on top honey! and please take your weight on your elbows.

Seriously though I am not the boy to ask, as I am a shallow price action only guy in highly liquid markets.
Never the less I love to learn.
 
commanderco said:
James James James
Do I have to do all the work in this beautiful relationship.
It is your turn on top honey! and please take your weight on your elbows.

Seriously though I am not the boy to ask, as I am a shallow price action only guy in highly liquid markets.
Never the less I love to learn.

Well, I said my bit earlier and it got no reaction, so I'll just lurk for the time being, thanks. :cheesy:
 
commanderco said:

I am sure that a great deal of info can be extracted from the Trading members.
Hummm, and what happens is that if potential extractees are unwilling, that extraction does not materialise. The word if is the smallest in the English language, but appears to be the most important for many practical purposes.
 
Top