With the Dow making new highs last week, we are now well and truly into unchartered territory. So how should you define the new targets?
The action over the last week satisfies an expectation we have had for the year 2006: a fresh all-time high. The move into new-high territory was not an easy breakout. In May, the DOW crept to within 90 points of an all-time high and thereafter sold-off to lose 8% of its value throughout the next couple of months - this was one of the strongest pullbacks the market had since the major low in 2002. In July, the market found its footing and once again made a second run for its all-time high. It has been all-up ever since and into today. Here's a toast to the Bulls for a well earned victory! Now it's back to work.
Now that we have the DOW trading at a new all-time high, the popular question seems to be "where is the next resistance?"
When a market is hitting an all-time high, looking for the next order of resistance or a target point is usually very tough, needless to say because it is literally in "uncharted territory," and we therefore have no prior history to use as benchmarks. In this case however, it is not as difficult as usual because we have the luxury of having the S&P500 largely trailing the DOW, and still lingering underneath its all-time high. While the DOW is the world's most popular benchmark, the S&P500 is the most significant because it has a very good balance between broadness and quality. This characteristic of the S&P500 is the central reason why it is used by nearly all equity market professionals as the "main" benchmark for US Equities. We have therefore looked there to set our next target point for a turn, even if it's the DOW that is in the lead. To arrive at a good projection for the DOW's first challenge, or resistance point in this all-time-high territory, we shall use a concept covered in the Broad Market Class that we call "translation of Support and Resistance." We are not going to do any short-term analysis this week, and just focus entirely on the big picture, and what we can expect in the weeks and months ahead:
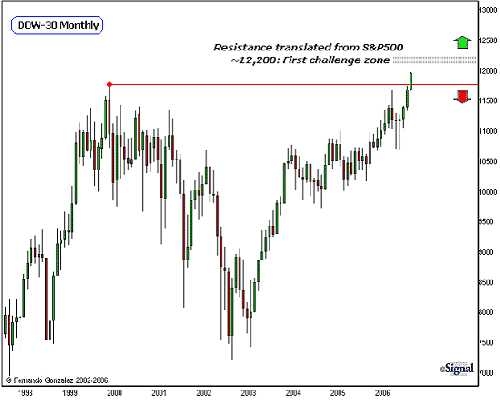
Chart Notations:
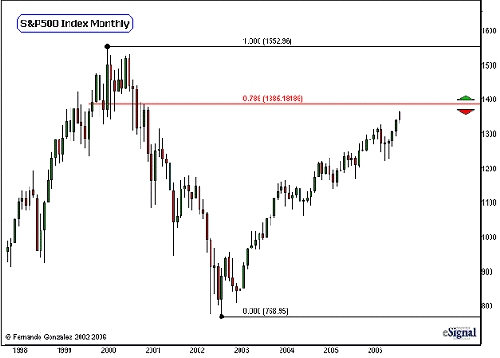
Chart Notations:
Note that in over 4 years of trading since the 2002 low point, the upward trend in the S&P500 (which is corrective of the prior decline) has had no pullback of greater than 9% magnitude. It has been a great and very consistent environment for US investors, as returns were positive almost all the way in those 4 years. We are now reaching a stage in long-term market cyclicality that the market is ripe for a good dose of profit taking. As we near this critical resistance point, what is likely to be the largest and fastest decline since the 2002 low point is imminent (relative to this time frame discussed). If the largest decline since the 2002 had a magnitude of 8-9%, then that means that if the market reacts to the .786 Fib retracement at this important cyclical juncture, the decline is likely to exceed 9% in magnitude. It is also likely to be a fast one. We shall maintain this posture for now, as long as the S&P500 is trading below the 1385 mark. The weeks ahead are going to be very pivotal in the markets. Let's tread carefully, as we always do, as the markets continues its progress through time.
The action over the last week satisfies an expectation we have had for the year 2006: a fresh all-time high. The move into new-high territory was not an easy breakout. In May, the DOW crept to within 90 points of an all-time high and thereafter sold-off to lose 8% of its value throughout the next couple of months - this was one of the strongest pullbacks the market had since the major low in 2002. In July, the market found its footing and once again made a second run for its all-time high. It has been all-up ever since and into today. Here's a toast to the Bulls for a well earned victory! Now it's back to work.
Now that we have the DOW trading at a new all-time high, the popular question seems to be "where is the next resistance?"
When a market is hitting an all-time high, looking for the next order of resistance or a target point is usually very tough, needless to say because it is literally in "uncharted territory," and we therefore have no prior history to use as benchmarks. In this case however, it is not as difficult as usual because we have the luxury of having the S&P500 largely trailing the DOW, and still lingering underneath its all-time high. While the DOW is the world's most popular benchmark, the S&P500 is the most significant because it has a very good balance between broadness and quality. This characteristic of the S&P500 is the central reason why it is used by nearly all equity market professionals as the "main" benchmark for US Equities. We have therefore looked there to set our next target point for a turn, even if it's the DOW that is in the lead. To arrive at a good projection for the DOW's first challenge, or resistance point in this all-time-high territory, we shall use a concept covered in the Broad Market Class that we call "translation of Support and Resistance." We are not going to do any short-term analysis this week, and just focus entirely on the big picture, and what we can expect in the weeks and months ahead:
Chart Notations:
- The Monthly chart of the Dow Jones Industrial Average addresses the Intermediate-to-Long-Term time horizon.
- Above, we arrive at the 12,200 mark (gray area above) as the first challenge area in the all-time high territory. We will allow a margin of 100 points in either direction. (note that 100 points in the Dow is less than 0.8% of its value). And how did we arrive at this value? We took or "translated" resistance in the S&P500 - a highly correlated market to the Dow and applied it here. We shall see this in the next chart.
- The arrows designate the directional bias for this particular time horizon (Int-Long-Term). If we find a market that is able to sustain trade above the gray area: this is full-on Bull market territory. On the flip-side sustained trade below the prior high (red line) puts the market vulnerable to getting sucked back into the Bear market range.
- We shall therefore take an overall neutral Int-Long-Term posture in between the former high (11,750, red line) and our target zone (~12,200, gray zone) - the reason for this is due to high probability that what we are seeing here is an unsustainable breakout. A SUSTAINED move into the Bull Market territory (green arrow) has significantly less probability than movement back into the bear market range (red arrow). This is because of a few very important reasons:
- The main benchmark of US Equities, the S&P500, is still within the confines of CORRECTIVE activity (discussed next).
- The NASDAQ, the market premier measure for Speculative behavior or "appetite for risk" is still in coma from the dizzying 84% loss between years 2000 and 2002. We cannot have a Bull Market when the Speculative market is still in the hospital's ICU. A Bull market is characterized by a movement of primary measures (such as the DOW and S&P500, in tandem with a strong Speculative market).
- A move into the Bull territory would make it easier to trust this breakout as the sky is the limit, but until then, it would be wise not to trust it. Let's look at the S&P500:
Chart Notations:
- The Monthly chart of the S&P500 above addresses the Intermediate-to-Long-Term time horizon
- The design of the long-term trend in the S&P500 is very different from the DOW. Note that it is trailing way behind, and is still within the confines of "corrective behavior."
- We have applied the .786 Fib Retracement here as the next Resistance point, and took that and translated it over to the DOW to arrive at our 12,200 resistance point there, just using some elementary math.
- In the S&P500, the .786 Fib retracement is the final frontier of resistance. A sustained trade above that point would put a 100+% retracement into play. We shall deal with that only if the market is able to exceed 1385. In the meantime:
Note that in over 4 years of trading since the 2002 low point, the upward trend in the S&P500 (which is corrective of the prior decline) has had no pullback of greater than 9% magnitude. It has been a great and very consistent environment for US investors, as returns were positive almost all the way in those 4 years. We are now reaching a stage in long-term market cyclicality that the market is ripe for a good dose of profit taking. As we near this critical resistance point, what is likely to be the largest and fastest decline since the 2002 low point is imminent (relative to this time frame discussed). If the largest decline since the 2002 had a magnitude of 8-9%, then that means that if the market reacts to the .786 Fib retracement at this important cyclical juncture, the decline is likely to exceed 9% in magnitude. It is also likely to be a fast one. We shall maintain this posture for now, as long as the S&P500 is trading below the 1385 mark. The weeks ahead are going to be very pivotal in the markets. Let's tread carefully, as we always do, as the markets continues its progress through time.
Last edited by a moderator: