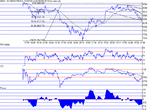
The DOW this week 29/07 02/08

ChartMan

Legendary member
Messages
5,580
Likes
47
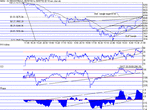
Great day! I was surprised at the rise because of the ND on phase from Friday. Still I did say the break would show in the futures this morning and so it did, up 150 before the open. A good solid steady climb up leads me to two minds again. The steady orderly rise and the close above 62% fib and above the triangle target would suggest more to come. On the other hand, is it really too much too quick overall? Phase suggests there is room for more, but RSI and CCI have gone flat..... This has made another possible bull triangle on CCI and a clear up channel on RSI.
Your choice really. :)
 

Attachments

  • dow290702.gif
    dow290702.gif
    15.6 KB · Views: 442
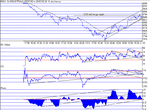
Good trading day with continued volatility and a 200 point trading channel intraday and 400 points on the 10 min charts. It looks like this may well be the top for now but there has been an RS switch.... Phase is sitting at the bottom of the newly formed up channel so support here is critical. The other down side is the 3 pk ND top shown on RSI,CCI and Phase. On balance I think we are going to lose support, and it may well go overnight. Right now (10:40 ) they seem stable at 8680.....
 

Attachments

  • dow300702.gif
    dow300702.gif
    15.6 KB · Views: 403
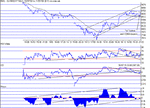
Well, I suppose I got it half right, or half wrong. :)
But now I think the picture is much clearer.We maintained support on Phase, and the ND on RSI and CCI turned around to become a downrend resistance break. This came about from the RS switch mentioned yesterday.Added to this, the general weakness seen in these three indicators, coupled with the price not dropping significantly suggests to me a lot more up side. I had been contemplating the possibility of a rounded top, but that's out of the window for now.
The up channel that has developd gives an upper target of 9000, but we have to break 8764 convincingly to get there.Solid support should be found at 8640.
My only concern is the lack of movement in Phase to confirm the price breakout........
Futs. currently at 8677 (11pm)
 

Attachments

  • dow310702.gif
    dow310702.gif
    16 KB · Views: 372
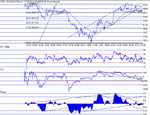
That's the end of that then. 8640 went quickly and so we went down.So much for yesterdays comments about more up side :(
The price is sitting on23% and it looks like next stop is 8300.The bear flag that has developed gives a target of 8400, 200 down from 8600. The price downtrend support is right on the closing price.......
 

Attachments

  • dow010802.gif
    dow010802.gif
    17.3 KB · Views: 333
23% never even got a look in today. Neither did 38% for that matter, with the dow just tumbling for most of the day.The drop through 38% did get retested , but failed and the drop continued to horizontal support around 8250, making a low at 8200 just off the 50% retrace. The rally into the close came very late, but with a welcome 100 points to the good, finishing close back to the 38% line at 8320. Could just be that 8200/8250 horizontal support may hold. 34 slope change on price could support that, if nothing else. :)
 

Attachments

  • dow020802.gif
    dow020802.gif
    15.1 KB · Views: 319
Top