The DOW this week 23/09 - 27/09

ChartMan

Legendary member
Messages
5,580
Likes
47
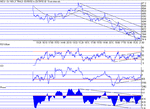
One minute it looks up, the next it looks down....From a strong finish on Friday, the DOW somehow lost the plot over the weekend. Still, at least I warned of the possibility of that upturn translating into a Bear Flag and that's just what we got, with a target of 7785 that was just about made. Ignoring the Phase dip, there looks to be signs of up side, but let's just wait and see....
 

Attachments

  • dow230902.gif
    dow230902.gif
    14.5 KB · Views: 504
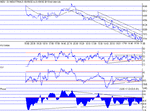
Yet more downside, but not excessive. RSI,CCI and Phase continue to support positive divergence and a turn around. Something has to give soon, one way or the other. Divergences cannot continue indefinitely.......
 

Attachments

  • dow240902.gif
    dow240902.gif
    14.6 KB · Views: 485
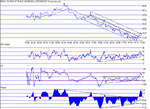
And so it came to pass. The divergence finally had its evil way and up we went. Mid and top channel resistance lines broken and this time it does not look like a Bear Flag. In fact, to the contrary... the tail off at the end of the session could develop into a Bull Flag- I wish. But looking on the bright side, for the first time in a while, If the goods are delivered , the target is 8000+ which is still the major upside resistance point.
 

Attachments

  • dow250902.gif
    dow250902.gif
    15.6 KB · Views: 456
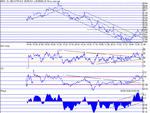
Great call. Not dificult though. The possible bull flag turned out good and the 8000 target was met. In fact it was tested twice and in doing so has developed a potential inverse H&S.That would point to another 100 points to the upside.If the Phase channel is correct, there's room for more upside. Sentiment wise, the bears may feel the bulls have moved too far. If the move is to continue, we need to see a clear break above 8000 accompanied by a pullback to retest it as support. 7872 should provide support...
Next week will see a new look to the dow charts........
 

Attachments

  • dow260902.gif
    dow260902.gif
    16.5 KB · Views: 416
8000 was lost and then 7870 support went , ending up finding support at 7700. The PD established earlier in the week is still in force, so we may yet see a reversal to the upside.
These cahrt s are now being presented using Sierra Charts. There are a couple of points I must make. Firstly, there is no equivalent to "Phase" in Sierra, so I will be relying on CCI to look for longer term divergences. These two are similar and hopefully, CCI will continue to deliver the goods. The calculations involved in determining the absolut values of CCI are different between AIQ and Sierra, however the important part, the "shape" or form is very similar. I will have to re learn the tiny differences in the two packages, but hopefully, that wont be too much of a problem.
 

Attachments

  • dow270902.gif
    dow270902.gif
    20.6 KB · Views: 376
Top