The DOW this week 16/09 20/09

ChartMan

Legendary member
Messages
5,580
Likes
47
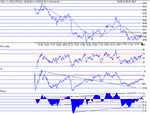
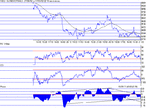
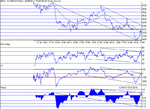
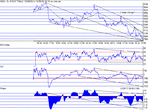
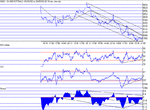
Fiday's call looks like coming good all round. After fiddling around a trading range of 8250 to 8350, we finally got a breakout today.The Positive divergence that started on the 13th continued throughout the day and ended strong, following a triangle breakout that should take us to 8420 region. Phase has plenty of room to run, being just above mid channel and broken above the zero line.The CCI RS switch came good too and the price has closed above the 100 MA for the first time in a while. Looking good for the bulls.....but for how long? The 100's are going to provide resistance all the way up to 9K. 8420 is a "double" Fib point from 8993 and 8728 so I see this as a major point for moving on up.
 

Attachments

  • dow160902.gif
    dow160902.gif
    14.1 KB · Views: 473
Tricky game , this. The bull rage flew overnight but was short lived. Although the double fib went, it was lost straight at the open.This news stuff with Iraq is causing mayhem.....Just goes to show that all the best TA in the world is not going to save you when the news hits....Time to take a step back and see how this pans out. I made a comment last night on Riz's VIX analysis that the chart looked like a cup and handle or a "W"- seems like that was a smart analysis, but more likely a lucky guess. Now and again we all get lucky in a good call.
 

Attachments

  • dow170902.gif
    dow170902.gif
    13.7 KB · Views: 421
If I didn't know better, I'd say things were bottoming out- they may still, even though after hours the dow is back down to 8075 area. If the Phase channel lines are correct, there's a lot of room for downside. RSI and CCI are also showing no signs of upside. Do I hear 7000 at the back?....
 

Attachments

  • dow180902.gif
    dow180902.gif
    16 KB · Views: 380
Looks like the bottomless pit has appeared.From the EOD charts, 7400 is the most recent low and is also a downtrend support line. The fall continues but Phase has not made lower lows and the price is sitting on downtrend support. Add to this a possible 3 slope change and we could be close to a bottom. RSI, CCI and Phase are all showing room for more downside. At 176 points below the 100MA, It's time to pull back. Still a hard call,but I wouldn't rush to be long.........
 

Attachments

  • dow190902.gif
    dow190902.gif
    15.2 KB · Views: 391
It now looks like a confirmed bottom, but for how long? Phase, CCI and RSI are all showing a confirmed positive divergence. We had the prior 3 slope change so it look like up for now. The 1 min chart on Friday closed strong too. From the Phase channel, we can see that there is not a lot of room to the upside, so don't get over eager until a firm up channel is established, along with some substantial price breakouts- 8000 and 8100. Be mindful of the fact that this could just be a Bear Flag developing- especially with regard to the narrow trading range and that EOD charts has support a long way down at 7400....CCI and RSI strength on the 1 min chart is still failing to move the price significantly.
 

Attachments

  • dow200902.gif
    dow200902.gif
    14.3 KB · Views: 355
Top