The DOW This Week...17/12....21/12

ChartMan

Legendary member
Messages
5,580
Likes
47
Good start to the week. Friday's analysis was spot on. From the open, we continued the rally off the bottom at 9750 to a steady top at 9930.Some interesting points to note today.Friday's rally closed at the 23% retrace.Today we sailed straight through the 38% ( unusual) and bounced right of the 50%- also unusual. We then drifted sideways to form a bull flag, ending up spot on the 38% retrace at 9980.
100MA at 9858.
Support at 9880, 9850,9815.
Resistance at 9932,9988 (68%) /10K.
Tomorrow should be up again....
 

Attachments

  • dow171201.gif
    dow171201.gif
    14.7 KB · Views: 534
And so it was, up again. Much the same as yesterday,strangely enough. A quick open 100 pts. up to bounce of the 62% fib level, and then formed a bull triangle, with a breakout at the " textbook" 75% width point, to give the good old 10K a severe bashing, to end the day sitting on the 62% line. A virtual duplicate of yesterday. It's as if the DOW is following a pre-planned course . :)
Not so easy to call tomorrow. There are signs of TA Neg Divergence shorter term, but the overall picture is still confirming an uptrend...Maybe a pullback to 9950 before continuing..

Support at 62% 9993/10K;9985/9900
Resistance 10,028;10092;10,124;10156
100MA is at 9923.
Interesting point: The DOW is forming a "V" bottom, with perfect uptrend slope angle, i.e. it is the same as the downtrend slope. So... the measured and orderly downtrend is being matched by an equally orderly uptrend. Nice. Not common at all. I can't see us closing near the top though for a couple of days at least at this rate. But then steady is solid.... I see the uptrend support line as being the one to watch for now, but watch out for moving too far away from the 100 MA line. Just now it's starting to widen, and another 100 point gap up tomorrow will certainly be too much.If that happens, watch out for a substantial retrace.
 

Attachments

  • dow181201.gif
    dow181201.gif
    15.6 KB · Views: 491
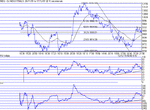
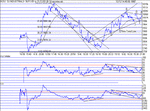
Another good go today. Almost went perfectly to form, but the drop went further than I expected to 9922...but nevertheless still bounced right on the 100MA at the time, a tad below the 50% retrace.From there we had a virtually trouble free run through resistance at 10,028 and bounce off the next step up at the 50 mark, to then rebound off the old resistance at 28. That formed another bull flag, and wew were off to the next resistance at 10,092, just not quite making it, falling 6 points short,in effect bouncing off the 82% retrace.The uptrend support line has stayed intact,with today's rally touching twice. Unfortunately the 100MA gap has now widened further, so expect more retrace tomorrow. We are now seeing negative divergence appearing and a triangle formation on RSI and CCI forming- not good.Phase is also showing clear failure to make higher highs. It looks like a retrace to at least 10K/ 62% and possibly further. If strength is not regained, this could be the top of the current rally. 9996/10K/62% is going to be critical.For me it's the do or die point. Support here and we go up, failure and we go down.
100MA at 9989...as is 62% retrace.
Support at 10,055,10,028 ; 62% 9992, 50% 9940
Resistance at 82% 10,079, 10156
Don't forget that support/res values switch as we go up and down...
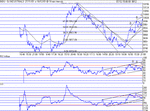
It's possible, though unlikely , that there is a very steep bull triangle forming, with the recent uptrend resistance line slope lessening.More likely, this is a sign of impending weakness, and may start to form another rounded top.
Tricky call tonight.....
 

Attachments

  • dow191201.gif
    dow191201.gif
    16.2 KB · Views: 486
If you ignore the brief fall today (where the trendline acted as brief resistance) a break of the trendline from Friday's low should be shorted, currently around 10060.
Dow has formed a bearish channel today.
S&P has formed a bearish triangle with a triple top at 1152.

Dow resistance above around 10080 is -
long term resistance line from May01 high.
upper bollinger band
1st swing high of previous decline
200 dma

Dow currently overbought on daily and hourly timeframes.

A retrace as you say to at least 10,000 is a good odds trade.

S&P
Resistance at 1151-1152 held, forming a triple top and bearish rising wedge.
Closed right on the resistance line from Friday's low (ignoring todays brief dip).
This was the 1st swing high from the previous decline.

Above is 200dma around 1170 and upper bollinger band at 1160, the long term resistance line from Sep00 at around 1163.
Resistance is at 1160, 1173, 1180.
Support 1140, 1130 - 1125, 1115, 1100 (major).

Shorting a break below 1148 is again a good odds trade.

Nas
No clear pattern that I can see, other than looks to have formed a rounded top.
Daily and hourly stochastics have crossed for down from overbought.
Briefly crossed above 2000 resistance which failed and was re-tested. The same for 1990. Both are support / resistance points.
Resistance 1990, 2000, 2010.
Support 1980, 1965, 1950, 1935. 200dma is around 1935.

I went long ON THE dOW at 9935 today, closed at 10,050.
Shorted at 10,050 and 10,180. (Should have closed 10,050 short on successful re-test of trendline and bullish pennent.)

Regards,
Ian
 
Well, we had the retrace to 10K, but will there be more? Although TA is now in a down channel RSI is sitting pretty close to 30 where it likes to bounce from.From the off, it was downhill all the way, just about, trading under the 100MA for most of the day. Ever since this latest rally started, TA seems to have failed to make convincing higher highs and so I think we will see more downside from here.It's broken out of the trading up channel to the downside, as well as testing and failing 10K /62% . Next stop 50% / 9936
100MA at 10,008
Support at 9936,9900,9882 (38%)
Res at 10K,10032,10092,10156 .
 

Attachments

  • dow201201.gif
    dow201201.gif
    14.5 KB · Views: 403
There is now an established new uptrend support line ...This was tested and proven today, touching at mid day to give a nice bounce point. Although today was up overall, the DOW failed to mage higher highs, to close making a new falling resistance line. RSI and CCI touched their respective upper support lines, failing to push it up higher. The triangle thus formed would suggest bull territory, but until we get a channel breakout on TA, it remains suspect. A break and hold above 10,065 will provide confirmation. Some comfort and confidence can be drawn from the fact that 10K/62% has not been lost. Tested points today were 10,010, 028 and 048. Given the next several days will be "silly" days, I guess there is no point in trying to even think about where we are heading. If you believe in Father Xmas, then 10,240. If you don't then there is major support at 9750... From an EOD point of view ( longer term) there has been negative divergence in TA since mid November, making further gains very difficult. We're not going higher until 10K has been proven as a consolidation level and further tests of 10,150 .
It is interesting to note the not inconsiderable difference in the intraday peak around 6th of 10,156 and then EOD peak on the same day for DJIA of 10,222....
100MA at 10,020
Support 10K and below
Resistance 10,040,60,92,156
 

Attachments

  • dow211201.gif
    dow211201.gif
    16.3 KB · Views: 409
Top