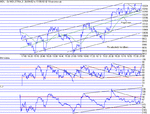
The DOW this week 13/05 - 17/05

ChartMan

Legendary member
Messages
5,580
Likes
47
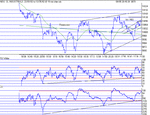
Friday I said we may find support at the support line and regression intersection at 32 and we did. The open moved straight up to resistance at 62 and retested 32 support. From there it was a nice uptrend for most of the day.Today was a most excellent day for trading on proven TA techniques. I suggested we should close above the 100 MA, but to close at HOD was most excellent. My only concern is that this move is not confirmed by Phase on the 10 min charts....There is an Inverse head and shoulders formed on the 10 min chart and my target for that is around 10,132- around the current resistance peak. Another 150 points tomorrow and we will be at the uptrend resistance line (180). The regression line is moving towards flat at last and an upturn will confirm a longer term uptrend. Should be another up day tomorrow.
100 MA: 10,043. Support: 10,090;064;035;010. Resistance: 10,132;164;250....
 

Attachments

  • dow130502.gif
    dow130502.gif
    16.6 KB · Views: 474
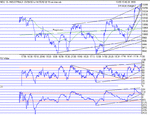
We got another up day. Can it be sustained? Not sure. Phase on the 10 min chart has failed to make higher highs, in fact it has made a head and shoulders. I can't recall having seen that before, but it may be significant.... The price action has seen at least 3 slope changes and that would signal a near end to the rise, as would 366 points in two days.Using EOD charts, there is strong Fib. support at around 10,256, there being coincident values here from the last two major lows.Perhaps that is why the price action saw that as resistance today, before finally breaking through. The next Fib. point up is 360 with EOD resistance at 380 odd. The EOD chart suggests a target for this breakout of 450....but perhaps not just yet. There needs to be some consolidation , although one may consider that today was mostly a consolidation day.I see 300 as a strong horizontal resistance/support line so I guess it's crunch time. Perhaps we will go down tomorrow to test support before moving on up?If 260 doesn't hold, then 232 should...
As for the action today, most un exciting, unless you happened to be long overnight again :) Sometimes it pays well, sometimes it kills you....Most of the day was spent between 260 and 232, just slowly drifting down, with much sitting on hands being the order of the day in the chat room. Those that weren't in a state of self inflicted comatose by 7 o'clock, would have jumped on the 3 pk. negative div. bottom and got a handsome reward of some 70 points. Being long tonight may be the sting in the tail...
100MA: 10,163. Support 10,262,232,200. Resistance: 10,300,364,380,450
 

Attachments

  • dow140502.gif
    dow140502.gif
    17.4 KB · Views: 462
Being long may have paid off, just, if you had the nerves to wait...but only just.Today's attempts to go higher have not worked out. 264 support/res. was non existant, but 232 proved strong support, being tested 8 or so times. If this fails tomorrow, it's tin hats time :)
It's mixed signal time so here's the options:-
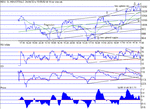
The price has formed an expanding triangle indicating high volatility. RSI and CCI are both forming triangles. RSI and CCI maintaining uptrend support, but Phase has neg. divergence, although broadly matching today's action.
In an orderly market (up or down) the dow price lies (generally) between 4 parallel lines. The last two days has seen action outside the top line.This leads to two options. Either the price is going to form a new up channel with an increased slope, or the price is going to drop down into the 4 line tramway.Not easy to see, but the regression line sits exactly on the second tramline down.
I favour,on balance, a new uptrend slope, so long as 232 holds.
Difficult call, but descision time tomorrow I think.
100 MA 10,222. Support: 10,232;10,134; 10,100. Resistance: 10,289;10,332;10,450
 

Attachments

  • dow150502.gif
    dow150502.gif
    17 KB · Views: 409
Hi all.

Does anyone else see this as a Head & Shoulders, although 10230 would have to break, and Finspreads are quoting the index up 50pts at the moment

Sorry for the poor chart. :(
 

Attachments

  • djia.bmp
    429.7 KB · Views: 253
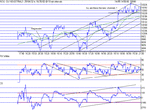
Today's action hasn't really resolved anything, except maybe that we are still thinking about these levels, not having tanked down. Up 50 or so points on the day was a nice steady rise with some nice volatility, but died towards the end of trading. A Diamond may have formed on the 5 min chart, but it's frond end is clearly flat so maybe not...what is clear is the triangle on the 1 min chart. Strong TA failed to push the price out of the 300 resistance and weakness failed to make the price tank so we seem to be balanced. If the three channel thing is true, then there is more upside, support being found in the top channel. CCI closed on uptrend support.Note all the RSI "slices" forming consecutive RS switches
100 MA: 10,253. Support: 10,276,264,250,232,132. Resistance: 10,300,316,340,450.
 

Attachments

  • dow160502.gif
    dow160502.gif
    17.1 KB · Views: 380
We got the breakout , to 350 then a fright as it tanked, to find support on the up trend at 260. Was this to be a false breakout? It never made the 400 target....No it continued to build strength adn consolidate between 260 and 300, testing the uptrend again, this time at 270 ish before taking off and heading for one of those HOD finishes on a Friday. Looks all set for a good start to next week and 400 going.We are now riding firmly in the top third channel and should move on up to resistance around 400-450. The bull triangle formed on 10 mins gives a target of 465, but if the breakout happens Monday first thing, it will be premature...so we may see a pullback to support at 280 ish...
100 MA:10278. Support: 10,332;313;300;276. Resistance: 10,350;450....
 

Attachments

  • dow170502.gif
    dow170502.gif
    17.8 KB · Views: 320
Top