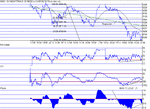
The DOW this week 08/07 12/07

ChartMan

Legendary member
Messages
5,580
Likes
47
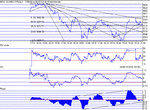
Charts got a bit skewed today because of the short day Friday. Sill we had the pullback and now we're sitting on critical support at 9236, just above the 38% retrace. Phase has moved to the bottom of the channel, so maybe it will provide support...Upper trend line gices resistance at 9375. Today's top failed to penetrate the 62% at 9404 so that will be the next target to break...
100MA : 9264. Support: 9364,9242,9216,9150. Resistance: 9290, 9308,9332,9364,9404.
 

Attachments

  • dow080702.gif
    dow080702.gif
    15.6 KB · Views: 579
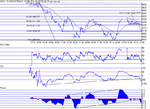
(236 was lost and we're now sitting on the bear flag target and 23% retrace. Phase failed support so now there is the real possibility of heading down to 8900.So, no up trend. All that we can look forward to is a sideways channel trading between 8900 and 9400.....and if 8900 goes...
 

Attachments

  • dow090702.gif
    dow090702.gif
    14.9 KB · Views: 537
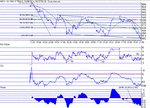
And 8900 went without a trace... A swift pullback to test 8900 and that was that. 8900, gone....Although there is no signs to suggest a bottom, I would have thought that 500 points in 2 days is a case of too much too quick, so perhaps we can expect a retrace tomorrow. Perhaps not....If I had to chose, I would say that the trusty CCI has not fallen as steeply as the price in the latter half of the day and therefore qualifies to be labelled as positive divergence. RSI and CCI are divergent too, and the two other recent occurances have resulted in a turnaround. The difference this time is that CCI is not clearly in divergence.... Still broadly a trading channel, unless we drop more...into the bottomless pit. :)
100MA: 9084. Support: 8800....Resistance: 8832,8864,8916,8964..
 

Attachments

  • dow100702.gif
    dow100702.gif
    15.2 KB · Views: 469
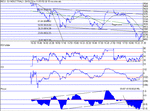
Strewth. Over 900 points of volatility today!!! whether it was luck or judgement that turned it around at half time I couldn't say. Must be football- a game of two halves.:) The first half, a run down to the bottom at 8615 or so, and the second half, a decent rally up to 8824. Given the steep single slope decline with virtually no indication of the bottom, ( mini double bottom at 8608 excepted), we may find ourselves in the rediculous situation where this turns out to be a huge "V" bottom and we fly back up to support. Nothing would surprise me in the current climate. There is just no sense behind this. All we can do is play the hand we are dealt....and what a few hands it has been so far. A bit like getting half a dozen "Pontoons" on the trot....
Make or break 8831 ish... Note the new Fib points....and we are sitting spot on 23%. Phase has recovered to the support channel line too...
 

Attachments

  • dow110702.gif
    dow110702.gif
    16.2 KB · Views: 446
lol yes, 2 halves of a game :)
Noticed the bull flag on the 1 min? if broken up tomorrow we certainly backtest 8900 and if Dow manages turning it into support lots of short covering may occur...exciting times

Riz
 
hi cm

what would "we are sitting spot on 23%" imply - i'm not too familiar with fibs?

thanks in advance....
 
Briefly, the Fibonacci levels represent resistance and support values that can (maybe) be found when the price moves from a high to a low, and then begins to retrace ( or vice verca).
So assuming that yesterday's low was in fact going to be "the low" ( which we don't know until some time in the future), we can make assuptions about likely price action, relative to the various Fibonacci levels. So, from yesterday's viewpoint, if we are to go up, then the 23% retrace from the bottom needs to be broken as a resistance, and become support. From today's early action, it would have been clear that this was not going to happen. They seem to work in all timescales and so can be very useful in Intraday trading, to estimate likely bounce points etc.
Well worth reading about them if you can, if only to understand their significance. I rarely use them, but I know Skim uses them all the time as part of her arsenal....

try here too

http://www.signalwatch.com/signalwatch/dailysignal/lessonofday_Fibonacci_Retracement_Levels.asp
 
Well we touched 8831 just for a tick, and that was that :) . Still , at the end of the day we've got a double bottom at 8619 and the divergence is still building, so it looks less likely for more down. We still have to get past the 23% Fib to move on up, maybe we'll get there Monday.... Look at the regression line relative to the 100 MA. when the 100MA is below the regression line, the price very quickly recovers into up trend, and vice verca.
 

Attachments

  • dow120702.gif
    dow120702.gif
    15.3 KB · Views: 351
Top