The Challenge

Well, I've been in the market for the last few days and come out of it with a profit of £42 which brings my total equity to £629.

You'll probably consider this surprisingly fortunate when you hear what happened to me...
 
It's been a few days since my last post...

Let me go back and tell you about my last trade.

The situation I was in could have potentially turned disasterous very quickly but fortunately I came out with a small profit. (see last post)

I have split the trade into four posts to break my thinking down across the time that the trade was open.

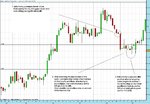
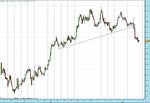
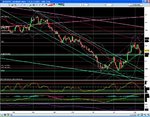
The main reason to enter short this market was based on a daily pin bar that occured at a previous support level which had now turned resistance.

However, I was so confident of this trade (mainly because this was where I had predicted the market might turn, even before the rally up to it had begun), that I went short before the close at £3 a point. This was essentially breaking my rules because I like to enter a trade on a break of the pin.

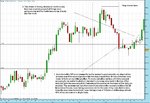
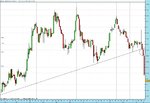
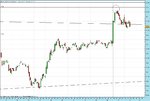
At any rate, on the following open, the market gapped sharply down and I was sitting on significant profit.

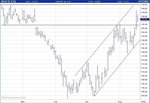
After watching the movement on the open, I saw that price was ranging. On the upside it was meeting resistance at a s/r pivot I had already drawn on my chart. On the downside it was putting in some temporary support with a two bar low on the hourly.

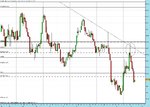
So I looked to add to my short on a break of this support - which is exactly what I did when it broke a little later.

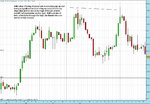
As it broke, I doubled my position so I was in the market at £6 a tick.

This was an important deviation from the way I like to pyramid (and which seems to be to the most logical way to pyramid).

That is to say, I should have added a second position when the stops on both would have meant that, if hit, I was still in profit overall.

However, the only place to put a stop on both positions (giving them room to move) that would have met that criteria was underneath the resistance not above it.

Still, I wanted to short the break badly, so I went ahead and sold £3 anyway.

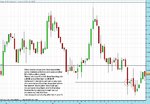
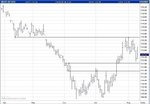
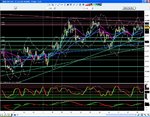
When the trade turned against me, I decided to move the stop on my second position a lot higher (and well out of the way) but put the stop on the initial position, just above the earlier high.

This was stopped out for +12 or £36 leaving me £3 a tick short in the market.
 

Attachments

  • bund1_realtime.jpg
    bund1_realtime.jpg
    169.7 KB · Views: 126
Last edited:
I have made detailed annotations on the chart that record what happened to me on this trade so I won't repeat it verbatim here.

To summarise: In frustration at potentially losing 4 ticks overall in a trade that was in significant profit earlier, I moved my stop way back to the top of the daily pin and hoped for a continuation down.

Instead, the market broke strong support on the hourly and rallied sharply into the close.
 

Attachments

  • bund2_realtime.jpg
    bund2_realtime.jpg
    193.2 KB · Views: 112
A laundry list of mistakes...

So, the first mistake I made was ignoring my rules on entering the position and taking the pin on the close rather than on the break.

The main reason I did this other than the confidence I had in the trade was that I was afraid the market would gap through any short order I placed and fill me much lower. If I didn't place an order at all, I feared the proverbial train would leave without me.

The second mistake was ignoring my rules on adding to positions. I did this because I got greedy. I wanted to have a large position short in what I thought would be a drop.

The third mistake was refusing to accept that the trade was going against me moving my stop way back, incurring excessive risk. This was due to frustration at the the fact that a winner would turn into a loser if I was stopped out but this fact in itself, is a result of breaking my rules.

Fourth mistake was ignoring the signs that that stop would be hit and stubbornly holding.

Fifth mistake was moving my stop once again out of nothing but fear of losing more money than I could afford to.
 

Attachments

  • bund3_realtime.jpg
    bund3_realtime.jpg
    159.1 KB · Views: 104
Last edited:
As you will see, this trade was concluded with a net gain of 2 ticks but I made my final mistake.

I repeated my earlier mistake and broke my rules on adding to a position despite the fact I was fully aware of the near disaster it had caused me.

Convinced the Bund was going down and wanting to capitalise on the move, I added another £3 in the face of a BOE and an ECB interest rate statement. I did this even though there wasn't enough of a gap between the entries.

This time however, I kept to my rules on stops.

I did shift them around (still a result of the fear from being stopped out and then the market continuing in the direction I thought it would) but I did not increase my risk.

And then in the ensuing volatility I was stopped out.

So - bottom line is: I got lucky. Very lucky.

I came out with £42 profit leaving me with £629 but I came very close indeed to losing a huge portion of my account.
 

Attachments

  • bund4_realtime.jpg
    bund4_realtime.jpg
    175.3 KB · Views: 114
Hourly TL break last night...

The chart below shows a break of a rather solid TL on the hourly timeframe.

I traded this last night.
 

Attachments

  • bund1.jpg
    bund1.jpg
    124.7 KB · Views: 117
There was a lot of volatility immediately after the FOMC statement last night which caused a sharp move up followed by a dramatic reversal and a violation of the TL into the close.

I wanted to go short on a break of the TL but I hesitated in pulling the trigger as when it broke it, the Dax was having trouble breaking up through a key resistance level I was watching. (For the most part these markets seem negatively correlated).

So I decided to enter on break of the support I had drawn on that chart at 112.55 for added confirmation, although I have to admit that as price hit it, I didn't wait for a break but shorted actually on the support.

I sold £3 and put my stop for this at 112.99 (a tick above the high of the doji).

I set a target of around 112.30 (support on my chart) and this morning after the move down got underway, I exited at 112.28 offered, for £81 profit.

In hindsight this might have been a little hasty since it actually broke my support and never looked back but at the time I was afraid of it reversing on me as it has done in previous trades so I decided to just close out.

It's a shame since I now have 112.04 offered but still, it's another win and that's what counts right now.

After todays win, I have £710.
 

Attachments

  • bund2.jpg
    bund2.jpg
    128.9 KB · Views: 146
Last edited:
This was a great opportunity today.

Hourly pin bar off a descending TL.

It had added confluence in the form of a S/R pivot and the 61.80% fib (from the daily high to low - 1-8 Aug).

These two lined up directly on top of one another.

The entry point (one tick below the low of the bar) would have been on a break of support, too!

With so much in its favour I am finding it hard to believe I didn't take this trade.

The reason I didn't was because the European (Dax) and US (DJIA) indexes were falling sharply and I was expecting Bunds to go up in turn because of the negative correlation between the two.

In hindsight it looks like the market ignored the "flight to quality" argument for buying bonds during a market sell off. Next time I might just trust the technical setup!

Oh well, onto the next...
 

Attachments

  • bund.jpg
    bund.jpg
    141.9 KB · Views: 120
These are the levels that I see as being currently in play in the Bund.

S/R pivot (previous support in April/May) at 113.40 was rejected and price has now put in lows around 111.80 which is interim support due to the consolidation after the move upwards/breakout in late July.

I see a break below this as potentially a bearish setup although price could stall (and possibly turn) at around 111.40.

The area between these two levels (111.40 - 11.80) is more like a pivot point zone.

If we go below 111.40, then I would think that a retest of 109.80 is certainly on the cards.
 

Attachments

  • bund.jpg
    bund.jpg
    69.7 KB · Views: 128
Hi BT,

Good to see you take advantage of some of the opportunities in Bund land.

I keep a track of a small range of markets on a daily and in more detail during the weekend. I thought you may like to see my analysis. You see the chart clearly if you click on it twice.

Plus Points: Yesterday, price successfully tested ascending trendline channel and short period EMA. Short period momentum indicator is correcting overbought situation. Equity markets currently weak and/or wild!

Negative Points: OBV isn't great nor today's muted price action.

I have my pivots at 111.5 and 111.7.

Fibonelli
 

Attachments

  • Bund 090807 Daily.JPG
    Bund 090807 Daily.JPG
    290.1 KB · Views: 138
Thanks for posting your analysis, Fibonelli.

I always find it very interesting.

I have a short bias on Bunds today but I am reluctant to go short with the major markets heading south like this...
 
Shock!

I came into work this morning, logged into my account as usual...

And found myself up £33!

I went to the open positions tab and found I was long the Bund at £3 a tick from 112.90.

Then I realised that I must have set an order that I had forgot to cancel!

The strange thing is, I don't remember setting an order.

I do remember looking at the IB4 (inside bar, smallest of four - circled on the chart) that was forming into the close and thinking that I would like to go long on a break but deciding not to take it because of the overhead resistance (hourly S/R pivot and descending TL).

At any rate, the market had gapped up this morning and I had been filled (presumably much higher than whereever I had my order) at 112.90.

Looking at the chart, I saw it had hit the resistance I had already draw in at 113.10 (see 5m chart) and come off.

113.00 didn't hold either so I closed it manually at 112.95 for 5 ticks profit!

So I made £15 on the position although if I had been filled right at the top...well, that could have been nasty...
 

Attachments

  • bund1.JPG
    bund1.JPG
    126.8 KB · Views: 149
  • bund2.JPG
    bund2.JPG
    116.3 KB · Views: 148
Well, there have been some incredible moves in the market over the last few weeks.

The Bund broke that pivotal S/R and went almost 80 points higher before turning again.

Let's see if this support now holds...
 

Attachments

  • bund.JPG
    bund.JPG
    69.6 KB · Views: 138
Quick update:

My current equity in this challenge is £725.

I'm away in France from next Wednesday for a week...

Best of luck to anyone trading these markets right now - we've seen some wild times! And to think August is supposed to be the "quiet" month...
 
Nice formation today!

Pennant on the Bund. Seen clearly on the 1 hr chart.
 

Attachments

  • Bund 280807 1hr.JPG
    Bund 280807 1hr.JPG
    282.2 KB · Views: 167
Top