As a Short-term trader do you ever look at longer term time frames? If not, then this article will explain why the longer term time frames can influence the shorter intraday ones.
Most independent Short-term Traders tend to ignore the Long-Term technical condition of the Market because they believe it is not important in their trading. Few things are further from the truth, that is, if you want to survive the market over a long period of time, and still be trading years, even decades from now.
In the same manner that the tides can raise or sink all ships, the larger trends, behavior and technical design of the markets greatly affects ALL independent traders, regardless of trading style. You can have an independent short-term trader who is consistently successful over a period of months or even years, but eventually, by basic design, the market is going to shift behaviors, and surviving in the new environment will be like learning to trade all over again, despite the past successes. The long-term lifespan of an independent trader is a series of winning and losing streaks, a series of adjustments to the market's behavior, an unending task of learning, and re-learning the market.
Take a look at your goals as a trader. What is it that you want out of the market? Money? Well, money is a given? what else? A lot of money? That is a given too. Let's take the best case scenario and say that you did make "a lot of money," how long will it be before you consume all that money and come running back to the market to look for more? Have you ever stopped to think that you will always be at risk, even if you are "successful"?
How about the goal of "consistent profits"? This is very possible, but consistency in profit-taking has a lot to do with how "in-sync" you and your trading/technical analysis style is with the market's current environment, which in turn, is subject to sudden change at any moment. Trading is not just difficult in the beginning. It's difficult in middle and all the way to the end as well (please don't kill the messenger). Do you know what it takes to survive long-term? Let's see.
A given trend or behavior in the market that has been ongoing for months or even years can change in one day. The market has done this many times before. The longevity or lifespan of an independent trader depends almost entirely on his ability to quickly adjust to the market's many changes. Changes in the market's behavior are as certain as the changes in seasons: do you have it in your overall plan to adjust to these changes, especially after the market has gotten you and all other participants accustomed to certain type of environment for months, or even years? All too often, the market will perform a major change in behavior at just about the same time as when everyone has "figured-out" or "confirmed" a unified, high-probability method of making money - when the market turns, it's back to square one for everybody. And I mean everyone.
The market will move from point A to point B with as few on board as possible, did you know that this is the market's basic design and natural tendency? And it makes sure few are on board by changing behavior and moving very quickly. That's why you're never on it.
The many times the market has changed behavior in the past is quite evident in its Long-term charts. You would not need to be an expert in technical analysis to identify major shifts in trends and changes in price action behavior. As a short-term trader, you will feel these changes directly in the Intraday market, as this is merely a small fraction of a larger design. This is true whether you see the changes in the long-term charts or not, one thing is for certain, short-term independent traders are greatly affected by larger trends. The larger (in time-frame) the change - the bigger the effect will be on all participants, regardless of trading style.
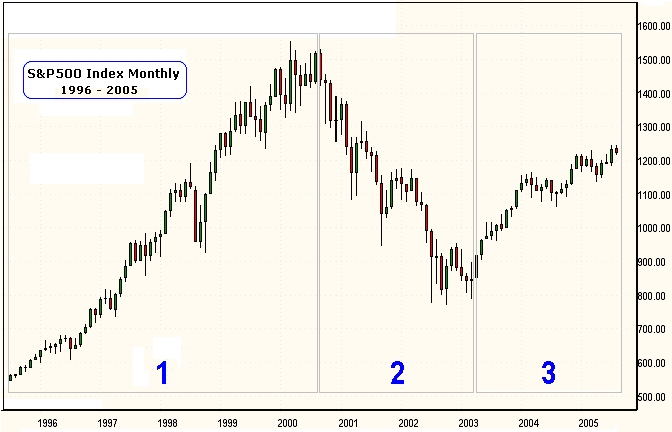
In the chart above, we have the S&P500 Monthly chart covering about 10 years of action. Note that each bar in the chart is a one-month period. Just by simply eye-balling the chart, we see three basic long-term environments dictated by direction of movement: from the beginning of the chart to year 2000, we have a massive up-trend (period "1" ; then from 2000 to 2003: a down-trend (period "2" and lastly; from 2003 to present, an up-trend (period "3" . If you were trading in the last 10 years, you will know that each of those major environments or trends required a specific type of approach to independent trading, regardless of trading style, and no matter how "short-term" the time frame. If you were to employ a specific type of day-trading approach that was successful in period one, odds are it would have gotten you killed in period 2 or even period 3. And vise-versa. Ask any INDEPENDENT trader that has survived the last 10 years, he has had to make at least 3 major "adjustments" that required almost a total adjustment to the market in order to survive through the 3 periods. And I'm talking about just "survival" and not even getting into "consistent profits" yet.
You can say that in periods 1 and 3, the bullishly-biased traders were rewarded, and in period 2, the bearishly-biased traders were rewarded. In trading each period, many attributed their success and/or failures due to a specific winning or losing trading, risk management or technical analysis style. However, when you look in retrospect, it is safe to surmise that the larger design of the market had a lot to do with success or failure, rather than any one specific method.
Looking in greater detail, you will observe that within the 3 major environments, there are many smaller environments that were distinct and even lasting for many months. These smaller "divisions" (some will call them fractals) in time frames go all the way down to Intraday and minutia levels. In fact, we can even say that the 3 major environments in the chart above are only a small portion of an even grander design. The adjustment periods are constant, and this is why no one singular technical analysis method will ever permanently work because the market is in constant pattern rotation and alternation.
Every period of time evolves from a series of larger trends and designs that we can learn and understand in order to manage the chaos of the moment. In today's world, we have the ability to zoom-in to the market in great detail, and zoom-out to see its even grander designs.
If your longevity as a trader is important to you, keeping track of the larger picture is critical to your survival. Even if you are a day-trader operating in the minutia time-frames, your understanding of the market's larger trends enhances your ability to navigate and make quick decisions within the chaotic short-term market. It will help prepare you for the market's many changes ahead, and your long-term survival as a trader has a lot to do with how quickly you adjust to the market's changes. It is a very big risk to ignore the big picture, so avoid taking the position that the large time-frames are not important to you as a short-term trader.
The charts and long-term data you need are easily accessible to you - use them! This way, you give yourself the chance to continue to do what you love for a very long time, longer than most others.
Most independent Short-term Traders tend to ignore the Long-Term technical condition of the Market because they believe it is not important in their trading. Few things are further from the truth, that is, if you want to survive the market over a long period of time, and still be trading years, even decades from now.
In the same manner that the tides can raise or sink all ships, the larger trends, behavior and technical design of the markets greatly affects ALL independent traders, regardless of trading style. You can have an independent short-term trader who is consistently successful over a period of months or even years, but eventually, by basic design, the market is going to shift behaviors, and surviving in the new environment will be like learning to trade all over again, despite the past successes. The long-term lifespan of an independent trader is a series of winning and losing streaks, a series of adjustments to the market's behavior, an unending task of learning, and re-learning the market.
Take a look at your goals as a trader. What is it that you want out of the market? Money? Well, money is a given? what else? A lot of money? That is a given too. Let's take the best case scenario and say that you did make "a lot of money," how long will it be before you consume all that money and come running back to the market to look for more? Have you ever stopped to think that you will always be at risk, even if you are "successful"?
How about the goal of "consistent profits"? This is very possible, but consistency in profit-taking has a lot to do with how "in-sync" you and your trading/technical analysis style is with the market's current environment, which in turn, is subject to sudden change at any moment. Trading is not just difficult in the beginning. It's difficult in middle and all the way to the end as well (please don't kill the messenger). Do you know what it takes to survive long-term? Let's see.
A given trend or behavior in the market that has been ongoing for months or even years can change in one day. The market has done this many times before. The longevity or lifespan of an independent trader depends almost entirely on his ability to quickly adjust to the market's many changes. Changes in the market's behavior are as certain as the changes in seasons: do you have it in your overall plan to adjust to these changes, especially after the market has gotten you and all other participants accustomed to certain type of environment for months, or even years? All too often, the market will perform a major change in behavior at just about the same time as when everyone has "figured-out" or "confirmed" a unified, high-probability method of making money - when the market turns, it's back to square one for everybody. And I mean everyone.
The market will move from point A to point B with as few on board as possible, did you know that this is the market's basic design and natural tendency? And it makes sure few are on board by changing behavior and moving very quickly. That's why you're never on it.
The many times the market has changed behavior in the past is quite evident in its Long-term charts. You would not need to be an expert in technical analysis to identify major shifts in trends and changes in price action behavior. As a short-term trader, you will feel these changes directly in the Intraday market, as this is merely a small fraction of a larger design. This is true whether you see the changes in the long-term charts or not, one thing is for certain, short-term independent traders are greatly affected by larger trends. The larger (in time-frame) the change - the bigger the effect will be on all participants, regardless of trading style.
In the chart above, we have the S&P500 Monthly chart covering about 10 years of action. Note that each bar in the chart is a one-month period. Just by simply eye-balling the chart, we see three basic long-term environments dictated by direction of movement: from the beginning of the chart to year 2000, we have a massive up-trend (period "1" ; then from 2000 to 2003: a down-trend (period "2" and lastly; from 2003 to present, an up-trend (period "3" . If you were trading in the last 10 years, you will know that each of those major environments or trends required a specific type of approach to independent trading, regardless of trading style, and no matter how "short-term" the time frame. If you were to employ a specific type of day-trading approach that was successful in period one, odds are it would have gotten you killed in period 2 or even period 3. And vise-versa. Ask any INDEPENDENT trader that has survived the last 10 years, he has had to make at least 3 major "adjustments" that required almost a total adjustment to the market in order to survive through the 3 periods. And I'm talking about just "survival" and not even getting into "consistent profits" yet.
You can say that in periods 1 and 3, the bullishly-biased traders were rewarded, and in period 2, the bearishly-biased traders were rewarded. In trading each period, many attributed their success and/or failures due to a specific winning or losing trading, risk management or technical analysis style. However, when you look in retrospect, it is safe to surmise that the larger design of the market had a lot to do with success or failure, rather than any one specific method.
Looking in greater detail, you will observe that within the 3 major environments, there are many smaller environments that were distinct and even lasting for many months. These smaller "divisions" (some will call them fractals) in time frames go all the way down to Intraday and minutia levels. In fact, we can even say that the 3 major environments in the chart above are only a small portion of an even grander design. The adjustment periods are constant, and this is why no one singular technical analysis method will ever permanently work because the market is in constant pattern rotation and alternation.
Every period of time evolves from a series of larger trends and designs that we can learn and understand in order to manage the chaos of the moment. In today's world, we have the ability to zoom-in to the market in great detail, and zoom-out to see its even grander designs.
If your longevity as a trader is important to you, keeping track of the larger picture is critical to your survival. Even if you are a day-trader operating in the minutia time-frames, your understanding of the market's larger trends enhances your ability to navigate and make quick decisions within the chaotic short-term market. It will help prepare you for the market's many changes ahead, and your long-term survival as a trader has a lot to do with how quickly you adjust to the market's changes. It is a very big risk to ignore the big picture, so avoid taking the position that the large time-frames are not important to you as a short-term trader.
The charts and long-term data you need are easily accessible to you - use them! This way, you give yourself the chance to continue to do what you love for a very long time, longer than most others.
Last edited by a moderator: