Best Thread The Basics of Trading

Stop-losses

Hi all

This really ties in with the last section on risk and reward. Knowing where to place a stop, is one of the hardest things to know. There are so many factors that come into play. Things like the volatility of the instrument that your trading, your risk tolerance..etc

Stop-losses are an important part of trading. I’ve said it before, when your learning to trade, the important thing is that you “stay in the game” long enough to put what you have learnt to good use. Stop-losses save you money, they don’t make you money. There will be many times as a trader, your stop gets hit, and your closed out of a trade only to look back later to find that you would have made an absolute fortune. This happens in trading, and it is time like that where you must remember that the stop loss is there to protect your capital.

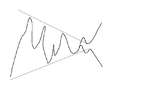
The point at which you are incorrect.

The general acceptance is that your stop is placed at the point at which you are told that you were incorrect. Most of the time it will be a break in a trendline, or a point of support / resistance that got broken.

Stopgone.GIF


With this example of SDRC, the support was at 450, and the natural place for the stop-loss was about 445. The support failed, the stop got hit and the price carried on lower. At 445 the price has violated the support line, so you would expect the price to fall futher, which is what happened in this case.


The trader versus the market makers

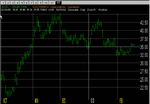
The unfortunate matter is that the market makers know where the stops are. They know because most people trade the same way. There are plenty of occasions when a market maker will go “gunning” for stops. What I mean by this is that they drop the price below support, to get the stops hit and then the price carries up, up and away.

sharegun.GIF


This GKN chart shows how the price fell below support at 197, hit 195 and then reversed. If you had placed a tight stop at 196, you would have been stopped out.

The only way to combat this is to allow the price a bit of room to move once the support / resistance / trendline has been broken, that way any stops that get gunned won’t be yours. How much you let the price move around is down to personal preference, but YOU MUST KNOW THE POSITION OF YOUR STOP BEFORE YOUR ENTRY, this includes the room for manoeuvre, and should be part of the risk calculation that we talked about earlier.

Mid-trade stop-losses.

In the risk and reward post, I talked about moving the stop-loss so that at any point in the trade, the risk does not exceed the reward. Moving your stop during a trade must only be used to lock in profits. If you move the stop loss to increase your risk, you are asking for trouble.

Moving a stop to protect your profits, should be placed under the last support for a buy or last resistance for a short. On a end of day chart you might look for the last low to act as the support, or the last high as the resistance, for example.

62008d1250335591-chart-depository-basics-trading-movstoploss1.gif


If we entry this Corus trade, short at 59, with a stop-loss at 64 and a price target of 45.

Risk = 5
Reward = 14
Reward / Risk ratio = 2.8:1

Now if the chart does this…..

62010d1250335591-chart-depository-basics-trading-movstoploss2.gif


At the current price of 52, and leaving the stop where it is, we would have this scenario

Risk = 12
Reward = 7
Reward / Risk ratio = 1:1.7

At this point we have more risk than reward. So the logical place to put the stop is at 57, as this is the last significant high, giving…..

Risk = 5
Reward = 7
Reward / Risk ratio = 1.4:1

Which is better than the 1:1.7 ratio.

Moving stop-losses to protect profits is just that, taking the profits that are on offer.


Stop loss placement is difficult and takes time to master, but as long as you remember the fact that stop-losses protect your capital, the emotional side of trading should be easier to follow.

For this week, I want you to image that you are in the following trades, where you think the stop-loss will be and a rough target. For all of the charts, we’ll be looking at the EOD chart, over the last 6 months.

<table border="1"> <tr><td>No.</td><td>Ticker</td><td>Name</td><td>Long/Short</td><td>www.ADVFN.com Link</td></tr> <tr><td>1</td><td>BSY</td><td>BskyB</td><td>Short</td><td>http://www.advfn.com/cmn/chrt/chrt_...0&ind1_2=&ind2_2=&ind_type3=0&ind1_3=&ind2_3=</td></tr> <tr><td>2</td><td>CBRY</td><td>Cadbury </td><td>Long</td><td>http://www.advfn.com/cmn/chrt/chrt_...0&ind1_2=&ind2_2=&ind_type3=0&ind1_3=&ind2_3=</td></tr> <tr><td>3</td><td>FP.</td><td>Friends Provident</td><td>Short</td><td>http://www.advfn.com/cmn/chrt/chrt_...0&ind1_2=&ind2_2=&ind_type3=0&ind1_3=&ind2_3=</td></tr> <tr><td>4</td><td>GKN</td><td>GKN</td><td>Long</td><td>http://www.advfn.com/cmn/chrt/chrt_...0&ind1_2=&ind2_2=&ind_type3=0&ind1_3=&ind2_3=</td></tr> <tr><td>5</td><td>VOD</td><td>Vodafone</td><td>Long</td><td>http://www.advfn.com/cmn/chrt/chrt_...0&ind1_2=&ind2_2=&ind_type3=0&ind1_3=&ind2_3=</td></tr> </table>
As always there is no right or wrong answers and I would love to hear from you.

Take care,
 
Right Mark, for what it's worth here is are my views on your choice of shares.

BSY Short S/L 589 (previous high) Target 458 (previous support)

CBURY Long S/L 319 (previous high) Target 390 (previous support)

FP Short S/L 99 (previous high) Target 82 (previous low)

GKN - would not trade short - all my indicators show downward trend.

VOD - long S/L 105 (previous low) Target 126 (previous high. )

As a novice I have probably made a right dingbat of myself, but if you don't try, you don't get constructive criticism :rolleyes:
 
BSY - currently at the lower edge of a range approx 555 to 690. As such it can be traded short if it breakes down through the range or long if it bounces.

For the long trade I'd enter at 571 on the swing with a stop at 550 and a target of 660.
For the short trade I'd enter at 550 with the stop at 620 and a target of 470.

Long: Reward/Risk is 89/21 = 4.2
Short: Reward/Risk is 150/70 = 2.1

CBRY - Interesting! Either a base forming OR start of a measured move down. Currently at support as last defined in Feb 2000.

Long above 340.Target 370. Stop at 315. RR 30/25 ~ 1 = rubbish.
[Short below 315. Target 285. Stop at 340. RR almost same as above.]

FP. Horrible congestion just above current area at 100p from Sep/Oct coincident with downtrend line from beginning of December. So the stop has to be about 102p. Just wouldn't short this share myself ... do you know what the yield is? It is projected at >7.5% ... has me almost salivating as a value player ... just want to see a retest of 82 for a 2B long entry ... very confused. Pass!

GKN - If your insisting on a long (and the yield warrants it) then the target is about 199. The entry is at the first high to go above the previous days high and the stop at the previous days low. Assuming Monday delivers the goods it is:

Entry at 182, stop 174. RR is 17/8 = 2. Horribly small on 'points' though - would need to check the spread/costs and factor in.

VOD - Long above 115, Target 124, Stop 104. RR 9/11 = 0.8. Too low.


Having done that can you expand upon why you selected the trade direction in each case? If it's to test us then that's fine but I'd like to understand the logic as several seem to be against my perceived direction of trend ...

Of them all only the first would seem attractive to me. A very interesting exercise though which will probably throw up all sorts of things/assumptions I have to learn/unlearn!

Cheers,

Andrew
 
Hi All

Here's my view on these:

BSY

BSYTS.GIF


The stop for me would be above the last up leg, so about 620. This also coincides with the support in December. The target would be the October low of 450.

So risk 40 points and reward 130. 3.25:1 reward risk ratio
Orchard - I think a 589 stop would be too close. I wouldn't class 589 as major resistance (which is what were trading off). On a 60min chart maybe that would be strong enough resistance to hold it. :)


CBRY

CBRYTS.GIF


Orchard, I agree with you on this one. The stop would be under the February low, as I would be looking for CBRY to start the up leg.
The target I've drawn in at 395 might be a bit ambious, but there is no major resistance until that point.

iSquared - Your right, if it starts a measured move down, then we would want to be out, hence the stop at 315


FP.

FPTS.GIF


iSquared - Your with me on this one, I wouldn't like to be short on it, but sometimes you find yourself in these situations and have to make the most of it.

The stop at 102 looks great, especially as it's just beyond the September / October support level.

Orchard - It's worth paying an extra 3 points to see if the 100 support will hold. If the old support wasn't there, then I would agree with you entirely


GKN

GKNTS.GIF


ooohhhh Ugly chart - Who said long on this one - oh yeah me :(

These are the types of trades, that I hit the wrong button on. The only thing to do is find the nearest exit and run, in this case just below the Friday close. I'm glad neither of you were going to trade this. :)


VOD

VODTS.GIF


This is a tricky one. I feel the stop should go under the last low, But I would feel uneasy if the current short-term trend changed, as the chart stands now though, I agree with Orchard although I would be monitoring it closely.

iSquared. I think you highlighted it brilliantly, when you say there wasn't enough reward.

Tricky one to trade that. :(


I hope that would class as constructive criticism, and as always, if you have any questions feel free to ask. It doesn't even have to be about the 5 shares mentioned above :)

Take care
 
Mark (FTSEB).

Thanks a lot,I got 3 out of 5 correct and learnt a lot from this exercise.
 
Mark,

I found this very useful. As a result rather than just skipping through charts until I see something interesting I'm making notes on them as I go. At the least time now indicates when, if any, I should have pulled the trigger - although so far in more cases than not staying away is the right thing to do. I think it too easy when looking at historical information, with 20/20 hindsight, to fool oneself into doing just the right thing while pretending that chart doesn't actually do what you anticipate after the brilliant (retrospective) entry!

Cheers,

Andrew
 
Simulating

Hi all

Thank you for your kind comments, it means a lot to me that your getting something out of this. :)

Thanks goes to iSquared for his last post and giving me a better idea of what to talk about this week.

So far we’ve covered, the basics of Technical Analysis, Money Management and the concepts behind risk and reward. That is pretty much the basics behind trading, so the next step is to start putting this knowledge to use.

If your looking at end of day charts, then the process of trading can be a slow one, after all you have to wait a complete day for a new piece of data.

The best way to practise is to go back over old charts and try to analyse it from there. I was once told “Practice doesn’t make perfect" – but perfect practise, now that’s perfect. So I would like to spend some time going over how I’ve analysed data in the past. This should really help the learning process: :)

Take a stock or a chart that you don’t know anything about, and pick a time 2 or 3 years ago. This way you have no idea of what has happened in the past, and therefore can not cheat. You then analyse the chart you have, and then forward the data one day at a time. This will create a new bar and from that you will have another bit of data to decide whether to trade or act on.

If your using the Sierra Chart package then you can use the right arrow key to jump one day at a time.
There is a function on ADVFN to view a set date range. From that what you have to do, is change the “To date”

Lets have a look at this example: Barclays 5th May to 5th November 1997 http://www.advfn.com/cmn/chrt/chrt_...0&ind1_2=&ind2_2=&ind_type3=0&ind1_3=&ind2_3=

BARC1.GIF


At this point I can’t see anything in the BARC chart that I like, so I’ll jump a day at a time until I see a set-up I like.


BARC2.GIF


Ok, this has bounced between the downtrend and the uptrend, so there could be something to watch here


BARC3.GIF


A couple of days later the downtrend has gone, so at this point I looking to buy and use the uptrend as support. – I’ll wait another day though to see if I can get a better entry.


BARC4.GIF


Now the chart has tested the uptrend, I’m happy to go long. So I’m long at 362 with a stop below the trendline at 355 and a target of 400 (which is the support in October). This gives a risk / reward of 5.43:1 :)


BARC5.GIF


One bar later and the trendline is still holding price, so I need to go one bar at a time until, I see something of interest.


BARC6.GIF


Oh dear. :( The trendline got broken and I was stopped out for –7 less any commission.
Now I’ve got to look back at the chart again and see if there is anything I should have seen or done differently.
In this case, I should have waited to see a solid bounce off the trendline before entering. I should have also seen the short-term downtrend which if broken would have been an indication that the price would be moving up.


And that’s how to practise trading. Simple really, but if you do it properly, you can really benefit from real data without having to wait days for the next bit of data.


I can’t think of anyway to put this into practise, so it’s the same exercise as last week, with different companies though. – imagine you are in the following trades, where you think the stop-loss will be and a rough target. For all of the charts, we’ll be looking at the EOD chart, over the last 6 months.

<table border="1"> <tr><td>No.</td><td>Ticker</td><td>Name</td><td>Long/Short</td><td>www.ADVFN.com Link</td></tr> <tr><td>1</td><td>ABF</td><td>A.B. Food</td><td>Long</td><td>http://www.advfn.com/cmn/chrt/chrt_...0&ind1_2=&ind2_2=&ind_type3=0&ind1_3=&ind2_3=</td></tr> <tr><td>2</td><td>AL.</td><td>Alliance and Leicester </td><td>Short</td><td> http://www.advfn.com/cmn/chrt/chrt_...0&ind1_2=&ind2_2=&ind_type3=0&ind1_3=&ind2_3=</td></tr> <tr><td>3</td><td>DGE</td><td>Diageo</td><td>Short</td><td>http://www.advfn.com/cmn/chrt/chrt_...0&ind1_2=&ind2_2=&ind_type3=0&ind1_3=&ind2_3= </td></tr> <tr><td>4</td><td>JMAT</td><td>Johnson Matthey</td><td>Long</td><td>http://www.advfn.com/cmn/chrt/chrt_...0&ind1_2=&ind2_2=&ind_type3=0&ind1_3=&ind2_3=</td></tr> <tr><td>5</td><td>MKS</td><td>Marks & Spencer</td><td>Short</td><td>http://www.advfn.com/cmn/chrt/chrt_...0&ind1_2=&ind2_2=&ind_type3=0&ind1_3=&ind2_3=</td></tr> </table>

As always there is no right or wrong answers and I would love to hear from you.

If you would like me cover anything else next week, then I’ll see what I can do. Just let me know by private message.

Take care
 
Can I just add a point here.... It's a well documented feature of the DOW, but may not be relevant to a specific stock, but worth noting anyway. The chart shows a typical triangle action. OK so you can't really be sure which way it's going to go. Patience will be rewarded. Afer the breakout, there is almost always a pullback the the old resistance/support, which, after the breakout reverses. So Support becomes resistance and vice verca.There will be a small loss of R/R, but with a higher probability of a winning trade......
 

Attachments

  • breakout confirmation.gif
    breakout confirmation.gif
    5.1 KB · Views: 1,250
And as luck would have it, today sees an exact example for real on the dow........The action today was not on the price, but in RSI. Sometimes it is seen in CCI and sometimes you will see it in the price.Either way, that is your buy signal.Good hunting.
Excellent series,FTSE.
 

Attachments

  • breakout confirmation dow.gif
    breakout confirmation dow.gif
    19.3 KB · Views: 1,613
Hi Mark.
I have looked at your 5 stocks and have set out my thoughts for the stops and targets.If we imagine we are in these trades.
ABF Long. Stop at 502,Target 545.
AL Short. Stop at 792,Target 648
DGE Short. Stop at 650,Target 565.
JMAT Long. Stop at 725,Target 795.
MKS Short. Stop at 318,Target 280.

I would like to see what you think Mark.
 
Mark,

Here are my attempts. My learning from this is that there are several trades here where I'd have to wait for the price to come to me. Even then there are several I would not take due to the RR issue.

I'm still undecided about the balance of anticipating a reversal from that point or waiting for some evidence. Personally I'm much more prone to wait for the latter (i.e. for a long either a higher high or a close above the previous days high (in these conditions I'll wait for the close above the previous days high for longs)).

ABF Long 530 Stop 499 Target 546 RR 0.5
AL. Short 784 Stop 801 Target 649 RR 7.9
DGE Short 569 Stop 650 Target 500 RR 0.9
Short 630 Stop 650 Target 500 RR 6.5
JMAT Long No way (no space to down trend line, no new highs/lows).
MKS Short 299 Stop 320 Target 285 RR 0.7

So of them all only AL. and the 'wait for it' DGE appeals. In both cases I'd sacrifice the RR for some movement in the direction I subsequently anticipate. the targets I've used have in the main been based on the previous high/low in the direction of the dominant trend. Target setting from a trading perspective is certainly a topic worth exploring IMO.

Cheers,

Andrew
 
Can some one please explain the meaning of the trading expression "Covering Shorts". I understand going long or short, but am not really sure what "Cover" means.

EG. With SB To open a short position I would sell and To close it, I would buy.
 
Hi FTSE Beater, Fluke and iSquared et al

Well, first post here (and first post ever on trading, so…big gulp)

FWIW, this is my reading of these charts (hope I’ve understood these candles)

ABF, long, buy 511, target 532, SL 500, R/R 2
Al., short, buy 760, target 720, SL 790, R/R 1.33
DGE. Short, buy 600, target 570, SL 650, R/R 0.6
JMAT, long, buy 740, target 800, SL 700, R/R 1.5

Coming up to speed with this thread but feel the only way to make progress is to publish and…

Look forward to hearing from you, Mark.

Regards

SoldierofOne
 
Hi all

Hi SoldierOfOne – Welcome to T2W, and straight in the deep end ;)

Thank you Chartman for posting up that chart. Shows exactly what I should have done with my BARC trade :)

ABF

ABFTS.GIF


I would put the stop at 498 (below the January support and just below the round number) The target would be the resistance at 545 which was support in September and December – which is exactly what iSquared has said.

Fluke, I think you got it spot on. The only change would be the Stop loss, as round numbers often offer support or resistance, but that’s a minor point at best.

SoliderOfOne. With regards the Stop, I think the same applies to you as Fluke. I think the target of 532 would be great if you were trading intra-day, but for End of Day trading you need to look for more major resistance. I’ll be hopefully looking into that over the weekend.


AL.

ALTS.GIF


Fluke, we agree with each other. Stop at 792 (above the last recent high) and the target of 648, as that is the January low.

ISquared. I can see why you set your stop at 801, but I feel if it broke out of recent high, then 801 would soon get taken out. The profit target was good though and a RR of 7.9 is great.

SoldierOfOne, a great place for the stop-loss. I feel think the same applies as before, the target could be a little further, but for a short-term target, I would agree 720 is the next stop :)


DGE

DGETS.GIF


Everyone said 650 as a stop which is great :)
The target is the difficult thing with this one. I would be tempted to say no target and just see what mid-air support it finds. If on the current chart you can’t see a logical target, then you need to see a longer time frame. Even when you do that though the only support I can see is at sub 400, but at those levels bargain hunters come into buy the stock up – so it’s a tricky one that one.

JMAT

JMATTS.GIF


asleep1bluepink.gif
Oh sorry – fell asleep looking at this chart.

The main problem is that it is just drifting, with no clear direction. I agree with SoldierOfOne. I’ve put the target and stop on the edges of the range, but if I found myself in this trade I would be looking to get out as iSquared pointed out.

Fluke. I think your right to set a tight stop, and just find the nearest exit door.


MKS

MKSTS.GIF


This is an interesting one because it is coming upto what would have been it’s profit target at 280. At this point I would be looking to narrow the stop, and get out at the first sign of a bounce off 280 (maybe with the view to short again after the break-out)

Fluke – I think your right, but then you end up with a poor R/R. 318 would be a good stop if you think that 280 will fail to hold.

iSquared I agree with you on this one, and I’ll make sure I cover target setting this week.


Well that’s how I see these charts. I hope my criticism came over as I might it, which is purely constructive. There are no right or wrong answers and I would like to thank SoldierOfOne for being brave enough to post up their views.

Thank you to those who posted and the next lesson on target setting is in production.

Take care,
 
I agree - beginners board

TC

I agree with your comments re: "THIS IS SUPPOSE TO BE A BEGGINERS FIRST STEPS".

I rate myself as not even a beginner, so am looking to threads like these to learn a few things. After not even half way through I am met with phrases like Risk/Reward, protective stop, cup and handle, BillG's nice but SCARY Sharescope chart, and many other terms.

As a beginner looking for an introduction to these concepts I was expecting something more basic. FTSE Beater please continue with your approach, its very helpful. The other folks wanting to contribute perhaps a small suggestion for others like me who are keeping quite and trying to read through this lot. Why not define any new concepts/terms before using them. This way more of us will benefit and follow your discussion. Perhaps other threads can be used for the more advanced trader if you feel you must discuss in a more technical vein.

Cheers
NastyItch
 
For the sake of completeness, perhaps I can add my own two penn'orth on short covering. As previously explained, a short position involves selling shares you don't own with a view to making a profit on a fall in price. Eventually you have to give them back to the original owner, which means buying them in the market at the price then prevailing. Obviously the hope is that you buy them back for less than the price at which you originally sold.

When you buy a share, the maximum at risk is the price you paid. If the share goes to zero, then you have lost your initial stake, but no more. With a short position, risks are unlimited. So you may sell at a 100 in the expectation that the price will fall to 80, giving you a profit of 20. If the price starts to rise, there is no limit as to how far it can go. Share prices can double quickly (particularly after a prolonged fall). A takeover bid may come in which raises the price. So you may sell for 100, which drops 100 into your account - some of which will be needed to buy back ("cover") later, but if the price rises to 1000, then you have a loss of 900 - hence the derivation of the expression "don't get caught short" - nothing to do with toilets! :D

After a prolonged fall, those holding shorts may feel that it is time to take their profit, so they "cover their shorts" by buying in the shares they have shorted so that they can be returned to their original owner. This buying can push up prices, and those who remain short see their profits decline, so they also decide to cover, increasing the buying volume, and accelerating the price rise. A rise in prices may be read by those not already in the market that a recovery is in place and these investors/traders may also start to buy, adding to the wave of buying from the covering shorts. This goes some way to explaing why initial recoveries can be so dramatic. One minute you have investors selling shares they hold, and there are also traders short selling, and no one buying. Then traders start to cover their shorts, genuine buyers also come in, and everyone who wants to sell has already sold. Short covering + genuine buyers + no sellers = a price spike up.

A sudden rally in prices due to short covering can be frantic, and is known as a "short squeeze". Market Makers may mark up prices if they know that there are a large number of short holders of the stock to shake them out. The big question when these rallies take place is whether it is just due to short covering - in which case once the shorts have closed their position the buying will dry up and the liklihood is that the share will revert to the original trend - or has the rally been caused by new buyers, in which case the buying may continue leading to a sustained rise in price.
 
Hi NastyItch.

Thank you very much for your post, it gives me an idea of who is reading and what issues need tackling.

I'm sorry for not explaining the terms better, and from now on I will make sure I do so. In the mean time, these are the terms you were asking about.

Risk/Reward - The risk is the amount your prepared to lose. The Reward is the reward you expect to get if the trade goes your way. If you then divide the Reward by the Risk you end up with a RR or Reward/Risk ratio - It's mainly used to get your mind to see if the trade your entering into carries to much risk for the reward, in which case the trade shouldn't be traded. After all you wouldn't buy a car that had mechanical problems as the risk of it breaking down is too high.

Protective stop - This is linked to a stop-loss. The stop-loss is there to say if the price goes against me this much then "I'll get out - It's already cost me too much" - The protective stop is normally set a long way from the price and is used as an Emergency stop loss to protect against big disasters. For one reason or another, it's really not worth having a protective stop - but a Stop-loss is vital!!!

cup and handle - This is a charting pattern. The best explanation I found is http://www.investopedia.com/terms/c/cupandhandle.asp
This is what the pattern looks like
dl3ma1.gif
.
It really is an advanced pattern and something I might cover later on.

Hope this Helps :)
 
Here is my input to see if it might help.

The UK market shuts at about 4.30pm and it has a natural tendency to see what the US is doing in the afternoon and copy it.However the US market continues to trade until 9pm gmt and many strong moves can happen in the last section of the US day only to be reflected by market makers when the UK opens the next day.This can make it quite difficult for UK traders to hold positions over night.

The basics of trading can be used on any market, many feel that its worth looking at the US because its a leader and not a follower.We only make money if a stock moves and one market where this is very prevalent is the Nasdaq market.An electronic market that can be traded from anyones pc anywhere in the world.A market that has big names like Microsoft and Intel amongst its leading companies.

I enclose a chart of a large Nasdaq stock and you will see that it moves over 100% from October into November.

Where can you view the charts for these companies?There is a company like Sharescope that gives end of day data. www.tc2000.com I enclose a sample of their charting package that costs about $29/month.
 

Attachments

  • tc2000.gif
    tc2000.gif
    11.3 KB · Views: 1,030
Last edited:
Setting Price Targets

Hi all

Thank you to iSquared for giving me the idea to do this.

We’ve already covered stop-loss setting and risk / reward analysis. The other part is of course price targets.

Your price target (as with the stop-loss) is governed by the time scale your trading in and how long you expect to hold the shares.

ALLDTS.GIF


This ALLD has 3 levels of resistance

322 – January support
363 – October and December Support
420 – High of January and also resistance in early September and back further.

The Short term target is 322, which as I say is the January Support. It’s the short-term target for 2 reasons, 1) It’s the closest to the current price and 2) It’s enough resistance to hold it on a short-term basis (the resistance was only valid for a week), and for a short-term trade, we would expect it to get there pretty quickly.

The Medium term target of 363 would take longer to get to than the short-term target, but that’s what you would expect. For 363 to be hit, it will have to take out 322 and although you would expect price to stop there, it wouldn’t hold it back long enough to be a problem.

The Long term target will have to get through both the short-term and medium-term resistance, but as were prepared to hold it in the portfolio for a while, that is not a problem.

Target setting comes down to how strong you think support and resistance is at the various stages. The text books say that the more often a level is tested and the longer the period it is tested over, the stronger it becomes. As Mr.Charts has pointed out in another thread, this isn’t strictly the case for there are complex reasons why it doesn’t always work, but as a guide I think it’s reasonable to assume the longer a support / resistance level holds the stronger it is.

Choosing how long your going to hold shares for, is a very individual thing and take many years to figure out what suits you best. Having an idea of how long your planning to hold your shares though should decide your target.

That is pretty much it for target setting. The only other thing to realise is that changing the target is no different to changing a stop-loss. There must be good reasons for doing it and it can be adjusted as time goes on and the chart develops. Just remember that a stop-loss MUST NOT be changed to add risk, but to protect profits where suitable.

For this week, I’m going to throw it open for you to analyse any share / index etc you like. Ideally a chart with movement and reasonable volume (so FTSE 100 companies). The chart can have multiple resistance / support points, and an idea of how long your planning on holding the instrument for is a good idea. On the same chart you can write in (as I have done with the ALLD one) the short, meduim and long term targets.

I look forward to seeing which charts you choose. If you need a hand posting up a chart, then this thread should help. http://www.trade2win.co.uk/boards/showthread.php?s=&threadid=4624&highlight=posting If not then you can always contact me.

Take care :)
 
Top