Joules MM1
Established member
- Messages
- 648
- Likes
- 142
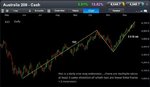
XJO
here are some extra ratios all terminating at the same place
in jpeg iv weekly: where i say "61.8 ext, weekly basis" should read " 61.8 ext, daily basis" in the Aug/Sept period
here are some extra ratios all terminating at the same place
in jpeg iv weekly: where i say "61.8 ext, weekly basis" should read " 61.8 ext, daily basis" in the Aug/Sept period
Attachments
Last edited: