swingin' the ftse: 2009

Confusing picture suggests better to stay in cash or taking small positions with near exit point.

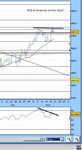
The major indices show weak evidence of swing uplegs, with no or marginal breaches of previous swing high. Resistance not far above caps upside potential, weak closes across the board suggest bearish follow-through tomorrow, though main trend remains up and inverted hammers are suggestive of building support.

At present I'm still interested in shorting if we are close above 4293, and in going long on a decisive breach of 4520. Apart from that I might be tempted to take a limited and short -term short tomorrow if we trade above 19/05 range then collapse through its low in a whiplash or key reversal.
 
Just to send up an early flag on a developing signal. If prices stay in the top of their range over the last 2 weeks , or break higher, we should see the 14 and 200EMAs converge in 5-6 days. If price can breach this pattern and consolidate with closes above we could see a significant move upwards from this support. It will be the first time the 14 will have crossed upwards through the flat or rising 200 since May 08: that move only lasted 9 days. The upward travel was not great, +2%, but the failure of this system preceded a massive sell-off of 17% over the next 6 weeks.

TA signals are fine, but the market's rejection of a TA signal can also tell us something.
 
for swing trades, are the bets placed on cash rolling or futures and does the s/l have to be
a large one. i.e >150 or 200. someone experienced could help here as i am failing on intrdy index trades based on p&F and ig 5mins index. either my entry is right and profit is small before my s/l is hit. and this is from 8 - 9.30am in the mornings. so would like to try the swing trades and have picked up marc rivallands book. TIA
 
Hi rajstar - Marc Rivalland's book is an excellent guide and really got me interested in swing trading using his simple rules. I watch the FTSE every day and mark it with swing highs and lows according to his system. P&F charts are a real help and more people would benefit from using them to confirm the real basic building blocks of TA - uptrend, downtrend, support and resistance.

I find Marc's method causes me only two problems. In an established trend, it does not give many signals to enter with the trend. So quite often, if you only took a position for the first part of a trend, his charts never shows you another entry point to get back, sometimes for for weeks.

Secondly, it is not precise on how to identify exit points to protect your profit. This is a common fault with many systems so he is not especially disappointing, but there are additional chart signals that will give a good guide.

I am posting these 'secondary' swing patterns on this thread as they answer both of my problems stated here.

With regards your problems, difficult to see what you are trying to do. But a 150-200pt s/l is massive in FTSE terms - equivalent to 2 or even 3 days ranges - it would be hard to be profitable if your exit point was consistently 1 or 2 or 3 days late.

Secondly, P&F works pretty well with end of day prices, but I don't hear of other people using it with a 5min chart.

If you're swing trading, I find rolling or futures for spread bet doesn't make much difference to me: rolling bets have a small overnight charge involved, but its tiny.

You are trading in a time zone against tough competition. Lot of professionals concentrate in this zone and the index can often reverse around 9 or 9:30. Look back over charts to see how often the high or low for the day or for several hours was at 9:30.
 
Big down day grabs the headlines. Well done if you took the slightly-non-orthodox swing signal and shorted at today's open from the low of 19/05. I am still flat, too busy to catch the fall and I hate chasing the price down. For me, the more significant things today were not the big drop but 1) the tiny gap from yesterday's low, and 2) we yet again stopped short of the head of the gap 4317-4294.

1) The little gap above today's range at 4445-4439 coincides with the 200EMA and could become resistance. If we rebound from a test of this gap, perhaps from a Fibonacci retracement level from the low eventually reached, it makes the pattern a hole-in-the-wall gap, a good short signal after the failure. If we cross the gap tomorrow, Tuesday or Wednesday and go north, it makes the patttern a 3-day unfilled gap reversal, a good long signal. Whichever happens, there is resistance not far above and support not far below so profits might be limited. And its not a very good hole-in-the-wall gap as it only printed 10 days after the high marking the end of the uptrend. Welcome to range trading.

2) 4317-4294 still offers support. A close below this gap would be bearish. A short signal would also come from a breach of the low 14/05 and this would mark, finally, the third orthodox down day from the swing high of 07/05, a bearish sign, or, if you like, a continuation signal if you regard 14/05 as a swing low. There's more support potential at 4194-4218 but worth a try.
 
tomorton - tks for your reply. i picked up marc's book on amazon. intrday signals did not help much on p&F. i was looking into 5mins chart on IG for entries - 8/21 emas and macd. i.e if p&F gave me a intrdy signal of a trend. i will now look into longer frames and hopefully swing entries might help. i will read this bb often. pls keep up the good work for starters like me. GN
 
Correction to my Post 205 above: the gap down today is larger according to Sharescope than I had thought - 4445 to 4410, rather than 4445-4439. To err on the side of caution I will regard 4410 as the foot of the gap and start of potential upside resistance.
 
Yesterday seemed to prove the power of gaps. Maybe activity was depressed pre-holiday, but price action certainly respected the gap above at 4410 and below at 4317. the result was an inside range day, also an NR4 (narrowest in last 4 by a squeak) and near-doji pattern with the close at just under the 51% mark, 4pts only above the open.

For much of the day I thought the high price was a chance to go short but resisted to await a recognisable signal. The doji pattern we eventually fell into suggests that the previous selling pressure has eased considerably. The Dow closed with an inverted hammer, which suggests similar.

The conventional response to an ID/NR4 is to place a buy order immediately above the range at say 4394, and a sell below, say 4334. Both these are short of the respective gaps and I would be inclined to traet break-out from yesterdays range as the lone signal as a trap. Being hemmed in by gaps, I would be more cautious and wait for breaches, and preferably confirmed by closes, beyond the far boundaries of the two gaps - that is, 4445 or 4293. These levels confirm the various directional signals and cancel the opposing signals but do surrender 40-50pts of move in each direction before entry, so more aggressive people will be in earlier.
 
I have now set up a chart view of the FTSE based on 2-day swings as opposed to the Rivalland 3-days as specified. This shows 21/05 as putative swing low, higher than previous, 14/05, with long opportunity from breach of 4411 and preservation of 4325. Although this view adds to the favour for the long side I would still be cautious and await clearance of the gap above 21/05.
 
FTSE100 3d Swing TA 26/05 – Putative 3d swing low. If confirmed, breach of 4521 would re-establish uptrend.

FTSE100 Candlestick TA 26/05 – Outside range day, whiplash price action, signalling long. Pattern suggests hanging man, indicating support. Gaps above and below tested but not bridged, with close just inside upper gap.

FTSE100 2d Swing TA 26/05 – Putative 2d swing low, but note that slightly lower than previous 14/05, and high 19/05 was lower than previous 07/05.

FTSE100 TA Notes - Medium-term trend sideways, though no conventional or potent swing high or low yet confirmed. Gaps 4294-4317 and 4194-4218 may offer support. Close below 4293 would confirm initial bearish break of support. Gap 4410-4445 coincides with 200EMA and could be resistance. Possible resistance 4521, high of 07/05. Breach of 4521 would re-establish uptrend. Candlestick and P&F charts show small-scale double top. 20RSI not showing overbought since correction from high 19/05.

Went long just prior to the close today on the whiplash and hanging man (-ish) pattern. However, only took position about one third normal size as FTSE rise this pm very sudden (not sustainable?) and the gap above and resistance at 4521 remain in place. I might be convinced to expand the position at tomorrow's close if we see sustained folllow-through and especially if upside resistance fails.
 
really interesting, thanks for sharing your analysis :)

do you think the momentum osc divergence on the little daily double top (8th + 18th may) has now been made redundant by the huge upswing today (26th)?

forgive me if this is a non question, i'm just learning.
 
I see the two tops as 07 and 19 May, the second slightly lower. RSI and Momentum seem to make similar tops, but not diverging, as the second indicator chart top also being slightly lower. The rise of 26/05 has not taken indicator into breach of second top, in fact Momentum continued to fall despite yesterday's price rise. These measures suggest upside resistance still in place.
 
I see the two tops as 07 and 19 May, the second slightly lower. RSI and Momentum seem to make similar tops, but not diverging, as the second indicator chart top also being slightly lower. The rise of 26/05 has not taken indicator into breach of second top, in fact Momentum continued to fall despite yesterday's price rise. These measures suggest upside resistance still in place.

i posted this chart a week ago, the divergence appears even stronger now (RSI).
 

Attachments

  • osc div edit.jpg
    osc div edit.jpg
    56.2 KB · Views: 148
Sorry doctor I was being too literal. That's not a divergence as the two trendlines linking the two respective tops are both falling. If one was rising that would be a divergence. But I get the gist of it and I think we agree, this is a bearish sign.
 
Last edited:
FTSE100 Candlestick TA 27/05 – Higher range day, closing above previous close but down on the day’s open. Narrower range than average, closing just above the half-way mark of the range. Gap above tested but not bridged, with close back below upper gap. Though pattern suggested dark cloud cover for most of day, low could not retrace more than 25% of yesterday’s range.

FTSE100 3d Swing TA 27/05 – Up day confirms 26/05 as swing low. Breach of 4521 would re-establish uptrend.

FTSE100 2d Swing TA 27/05 – Up day confirms 26/05 as swing low. Breach of previous swing high at 4513 would be bullish, confirming uptrend above 4521.

General TA Notes
Medium-term trend sideways, no significant swing high or low yet confirmed. Gaps 4294-4317 and 4194-4218 may offer support. Close below 4293 would confirm initial bearish break of support. Gap 4410-4445 coincides with 200EMA and could be resistance. Possible resistance 4521, high of 07/05. Breach of 4521 would re-establish uptrend. Candlestick and P&F charts show small-scale double top. 20RSI not showing overbought since correction from high 19/05.
Dow – Strongly negative candlestick suggests significant fall of FTSE imminent to re-balance relationship between these indices.

My long still running, but I expect a hit tomorrow morning when we re-open and the FTSE tries to re-balance with the US. I suspect they are very perturbed over there by North Korea but maybe its GM or something else, I never never read the market reports. I still expect the FTSE support from gap 4293-4317 to hold and would have to exit and reverse short if we close below this zone.
 
FTSE100 Candlestick TA 28/05 – Lower range day, closing below previous close but up on the day’s open. Significant gap down at open, but bridged and price recovered to finish above the mid-point of the range. Some charts show price action resembling doji pattern: such a very narrow body between open and close would suggest prevailing trend weakening quickly, in this case a bullish signal. Narrow range, not testing gaps either above or below.

FTSE100 3d Swing TA 28/05 – 26/05 remains swing low but lower range did not extend upleg. Breach of 4521 would re-establish uptrend.

FTSE100 2d Swing TA 28/05 – 26/05 remains swing low but lower range did not extend upleg. Breach of previous swing high at 4513 would be bullish, confirming uptrend above 4521.

General TA Notes - Medium-term trend sideways. Gaps 4294-4317 and 4194-4218 may offer support. Close below 4293 would confirm bearish break of support. Gap 4410-4445 coincides with 200EMA and could be resistance. Possible resistance 4521, high of 07/05: if breached, would re-establish uptrend. P&F chart shows small-scale double top. 20RSI not showing overbought since correction from high 19/05. Line chart study suggests bull flag formation with two successive higher highs and higher lows. Price has breached but not closed above 61.8% retracement from low 26/05 to high 19/05. Weak hole-in-the-wall gap pattern at 21/05 probably too weak and now played out to have predictive significance.
US – Strong recovery suggests significant rise of FTSE imminent to re-balance.

Still holding long, FTSE weakness never got so bad as I thought it would, and strong US finish is hopeful.

I still expect the FTSE support from gap 4293-4317 to hold and would have to exit and reverse short if we close below this zone. Gap above has survived by just 6-7pts but I expect will still offer resistance, and the 200EMA is in there too. Ranges like these are a real test, we have been in a 226pt range for 14 sessions - as long as positions are not over-sized it might be quite viable for swing traders to place no stops within this range - until we break out, price will come back and get you out of jail. But watch for the break.
 
FTSE100 Candlestick TA 29/05 – Higher range day, closing above previous close but down on the day’s open. Narrow gap up 4408-4415 unfilled and may provide support. Also suggests 3-day unfilled gap reversal short possible. Opened in gap 4410-4445, price rose beyond this range but fell back to close within.

FTSE100 3d Swing TA 29/05 – 26/05 remains swing low. Higher range day extends upleg. Breach of 4521 would re-confirm uptrend.

FTSE100 2d Swing TA 29/05 – Putative 2d swing high, not yet breaching previous 4513. Breach of previous swing high 4513 would be bullish, re-confirming uptrend above 4521.

General TA Notes
Medium-term trend sideways. Gaps 4408-4415, 4294-4317 and 4194-4218 may offer support. Close below 4293 would confirm bearish break of support. Gap 4410-4445 coincides with 200EMA and has shown resistance. Possible eventual resistance 4521, high of 07/05: if breached, would re-establish uptrend. Opened 29/05 on 61.8% retracement of fall 19/05 to 26/05: this level breached but offered resistance, causing price to close below. P&F chart shows small-scale double top. 20RSI not showing overbought since correction from high 19/05. Line chart study suggests bull flag formation with two successive higher highs and higher lows. Weak hole-in-the-wall gap pattern at 21/05 was bridged 29/05 and no longer significant.

US – Strong recovery near close (near to high of week) again requires significant rise of FTSE to re-balance. Nasdaq Comp bullish, breaching previous 3d swing high making new high of year, establishing 29-wk high.

Still long, pleased to see another strong US finish. This calls for strong early action on Monday, if sustained, possibly even closing clear of gap resistance 4410-4445. This market is not a bull but it certainly doesn't want to go down.
 
nice analysis, tom

i'm long too, but closed it at 4450 just before dow close (SBing). will re-instate monday assuming no week-end disasters and looking for a price down around 4430 or so if i can get it.

cheers - have a good week-end

jon
 
g'day....really enjoyed all the talk....just one thing.....I didnt get this thing: "re-balance"....could you explain that for the rest of us..thanks....

US – Strong recovery near close (near to high of week) again requires significant rise of FTSE to re-balance.
 
Top