You are using an out of date browser. It may not display this or other websites correctly.
You should upgrade or use an alternative browser.
You should upgrade or use an alternative browser.
Hi Jon - I don't take today as a putative swing low as I don't see a swing high since the swing low 23/01. I still these the US trend as, at best, unclear, and at worst, just a massive S&P 2 month-long bear flag comprising min-bear-flags in series.
However, the FTSE high today leaves a gap to Friday's low and this has clear short-term long possibility.
However, the FTSE high today leaves a gap to Friday's low and this has clear short-term long possibility.
barjon
Legendary member
- Messages
- 10,752
- Likes
- 1,863
update
Following the new swing low all our three traders are in play long from around 4152.
Billy has moved his top to break even.
Sam has taken half off the table at 1:1 (+116) with stop on remainder at break-even. He will look to re-instate the closed half on a pullback.
Clarence has lifted his stop to below (10 points) Friday's low with the intention of trailing it up if the move continues.
Me? I've got a small swing position running from 4155 with stop at breakeven, but I'm concentrating on intraday favouring longs. Such is current volatilty, that's been quite productive even on down days.
good trading
jon
Attachments
Joules MM1
Established member
- Messages
- 648
- Likes
- 142
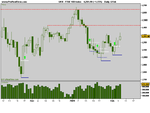
nice pic....amzing how beautiful the fractal structures are......hmmmm....pity its historical.....still, very pretty1HR chart
Are you still long?
Hello , new to the thread, given the overnight move are you still long or looking to go short yet? What timeframes do you work to as I haven't seen much activity on this thread?
Sorry if these are obvious questions but looking to learn to swing trade effectively and I think I maybe looking too short-term in my approach.
update
Following the new swing low all our three traders are in play long from around 4152.
Billy has moved his top to break even.
Sam has taken half off the table at 1:1 (+116) with stop on remainder at break-even. He will look to re-instate the closed half on a pullback.
Clarence has lifted his stop to below (10 points) Friday's low with the intention of trailing it up if the move continues.
Me? I've got a small swing position running from 4155 with stop at breakeven, but I'm concentrating on intraday favouring longs. Such is current volatilty, that's been quite productive even on down days
good trading
jon
Hello , new to the thread, given the overnight move are you still long or looking to go short yet? What timeframes do you work to as I haven't seen much activity on this thread?
Sorry if these are obvious questions but looking to learn to swing trade effectively and I think I maybe looking too short-term in my approach.
Hi churchie - I would advise caution. The time ti go short was Tuesday, as we breached Monday's low. The stop loss of Monday's high has not been breached so it woiuld be legitimate to be still short, though yesterday's candle was a clear hammer pattern, ssuggestive of a possible reversal. The Dow also made a strong late 200+pt recovery last night, and even though the US charts don't look as strong to me as the FTSE, its dangerous to be short when the Americans are buying.
Hi churchie - I would advise caution. The time ti go short was Tuesday, as we breached Monday's low. The stop loss of Monday's high has not been breached so it woiuld be legitimate to be still short, though yesterday's candle was a clear hammer pattern, ssuggestive of a possible reversal. The Dow also made a strong late 200+pt recovery last night, and even though the US charts don't look as strong to me as the FTSE, its dangerous to be short when the Americans are buying.
Good points, thanks for the input.
Technically Fundamental
Senior member
- Messages
- 2,810
- Likes
- 178
Enter the newbie...
Erm a quick question for you professional trader people.
How do you conclude a level which if breached will convince you of a trend?
I regularly find myself upset when hold out for a big gain when attempting to short an uptrend. I then get scared to try buy in the uptrend in fear of a dip...
Any advice or do I just need more balls and experience?
Hi Aronmalins - A very logical question that I also ask myself when looking at a new strategy, but I suspect it doesn't have an answer - that is, an answer that helps you make a profit.
Yes, you can devleop rules that say I must wait for a close of a 15min bar above this level or a 1day bar or whatever or look for a breach of at least 5% above the breach or 20pts or any number of these things, plus confirmation by MACD and all the rest. I use such rules, we all do, but I don't think they make me more profitable. I think more and more that entry signals are little better than random points and it is exits that count. I wish I could take all the entry points I see, as long as I can get out really fast when the trade doesn't go the right way. I could win a lot of money if I didn't keep losing so much money.
Yes, you can devleop rules that say I must wait for a close of a 15min bar above this level or a 1day bar or whatever or look for a breach of at least 5% above the breach or 20pts or any number of these things, plus confirmation by MACD and all the rest. I use such rules, we all do, but I don't think they make me more profitable. I think more and more that entry signals are little better than random points and it is exits that count. I wish I could take all the entry points I see, as long as I can get out really fast when the trade doesn't go the right way. I could win a lot of money if I didn't keep losing so much money.
Enter the newbie...
Erm a quick question for you professional trader people.
How do you conclude a level which if breached will convince you of a trend?
I regularly find myself upset when hold out for a big gain when attempting to short an uptrend. I then get scared to try buy in the uptrend in fear of a dip...
Any advice or do I just need more balls and experience?
Hi,
I'm not a professional, just a retired amateur, but I believe that Tom is correct when he says that exits are more important than entries. How many times have you seen a profit disapear before your very eyes, never to return on that trade, but worse, turn into another loss which slowly bleeds your account to death?
This haemorrhage of one's account is what has to be avoided. As long as the profit is no more than a few points and the account is well padded, it is ok to see if the price will recover. However, constant losses should be brought to, at least, break even.
This why I believe that overnight trading is bad for one's wealth unless you can put a stop to, at least breakeven, with the price a reasonable distance away from that stop, before the day's close.
I try to get into a trade in the morning and, normally, get out before I go to work in the afternoon. I prefer that few points apple, rather than the possible, but not certain, orchard waiting to be picked the next day.
This is, very much, character and you must be comfortable with yourself, when trading.
Don't forget that overnight trading has another caveat. You have to sleep on it. 🙂
timsk
Legendary member
- Messages
- 8,912
- Likes
- 3,629
Hi Folks,How do you conclude a level which if breached will convince you of a trend?
It's been a while, so I thought I'd look in and say hello.
Aaron - if you accept the widely held definition that an uptrend consists of a series of higher hghs and higher lows, then you're looking for this sequence to be breached. Most traders focus on bar and candlestick charts because they contain the most information about price movement. For the purposes of assessing the current trend of an instrument, there is a strong argument in favour of 'less is more', i.e. using a chart that paints a very simple and clean picture. A basic line chart is the first step in this direction, followed by a Point & Figure chart. Thereafter, you can go very basic with Three Line Break, Kagi and Renko charts. The attachment shows three charts of BSY and one of the FTSE 100 (bottom right). The top left chart is a Renko chart and, I thnk you will agree, shows the trend very clearly. Thee is little doubt that the prevailing trend is up, but price is retracing having hit resistance around the 500 mark. Have a play with different chart types to see if they help.
On a more general note that is pertinent to the thread, there are quite a few stocks that look like BSY. That is to say, they appear to have bottomed out, with higher lows and higher highs starting to form. The main index lags behind, dragged down by the financials no doubt. Many stocks show price above the 50 SMA and the 200 SMA is flattening out, with the prospect of a 'golden cross' in store for many in the coming weeks. With the low interest rates, perhaps savers are thinking that stocks look cheap and the dividends make them look all the more attractive. I'm not one for calling tops and bottoms, but there are clear signs that the market may be starting to pick back up.
Tim..
Attachments
PokerBrat
Active member
- Messages
- 197
- Likes
- 25
Will you be looking for another long if it breaks todays high around 4190?
I don't see the 12th as a swing low, as the next day opened and closed below the previous candle, continuing the downtrend. But obviously it did fill your order.
Price is now resting right on the trendline I have on my chart, so looks like a nice setup if it rallies tomorrow.
I don't see the 12th as a swing low, as the next day opened and closed below the previous candle, continuing the downtrend. But obviously it did fill your order.
Price is now resting right on the trendline I have on my chart, so looks like a nice setup if it rallies tomorrow.
PokerBrat
Active member
- Messages
- 197
- Likes
- 25
Hmm, after another look, I'm not sure I like the set up as much I thought. Price is being pinched into a wedge at the moment, so there may not be much upside to a long position.
Wish I could work out how to get charts out of ProRealTime, then I could show the pattern.
Wish I could work out how to get charts out of ProRealTime, then I could show the pattern.
brutusdog
Guest
- Messages
- 759
- Likes
- 194
Hmm, after another look, I'm not sure I like the set up as much I thought. Price is being pinched into a wedge at the moment, so there may not be much upside to a long position.
Wish I could work out how to get charts out of ProRealTime, then I could show the pattern.
hit the printer symbol on the chart (bott left)
select save (not print)
save as a png and then its easy to upload the attachment to a post.
Hi Pokerbrat - Sharescope and ADVFN show 12/02 as swing low, as this is confirmed by 13/02 bar with higher low and higher high. As today breached the 12/02 low, today becomes the new putative swing low. The low remains higher than the 23/01 low (though the last swing high is weak compared to 06/01) so, yes, I will go long if 4190 breached and 4127 holds.
I realise that the S&P has remained trendless since 21/01 and finished weak on 13/02. The Dow was in downtrend to 12/02 and the up day 13/02 could be just another false start, there have been 4 already in this downleg.
I realise that the S&P has remained trendless since 21/01 and finished weak on 13/02. The Dow was in downtrend to 12/02 and the up day 13/02 could be just another false start, there have been 4 already in this downleg.
Similar threads
- Replies
- 26
- Views
- 10K