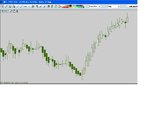
Hi Jon - I saw this thread earlier but your illustration is a lot clearer. Although I don't have H-A charts, that still doesn't excuse me for not being long from July.
Tom - you're being too hard on yourself!
If you want HA charts, download PRT - they have them and it's free.
- - - - - - - - - - - - - - - - - - - - - - - - - - - - - - - - - - - - - - - - - - - - - - - - - - - - - - - - - -
I've been having a little Friday afternoon play in the sandpit of TA and I have a modified version of the strategy outlined in the FF thread, linked in trendie's post on the thread linked in Jon's post. It goes like this . . .
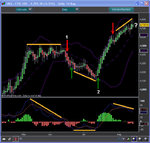
Chart attached is a Heiken-Ashi chart with:
A. Bolly Bands set to the default of 2.0 standard deviations.
B. MACD set to a fast setting of 6,13,9.
Set Up:
1. The HA candle must kiss or breach the upper BB (for shorts) or the lower BB (for longs).
2. MACD should exhibit coequal or positive convergence with price coequal or falling (for longs) and coequal or negative divergence with price coequal or rising (for shorts).
Entry:
Once the set up has occurred (both 1 and 2, above), the next candle should be either a wide range doji or a candle of the opposing colour. (This may or may not be the same candle that's kissed/breached the BB).
Stop:
Just above/below the high/low of the candle that's kissed/breached the BB.
Exits:
Take half profits when the candle touches the opposing BB. For the remaining half, set a trailing stop beneath/above the low/high of the previous candle.
Notes:
Ignore inside candles (as in 1 on the chart).
Two trades shown on the chart - No. 1 a short and No. 2 a long.
I haven't tested this or anything, so I've no idea how it would work out in practice! Gotta go now, the missus has just come in and I'm wanted. Now!
Tim.