You are using an out of date browser. It may not display this or other websites correctly.
You should upgrade or use an alternative browser.
You should upgrade or use an alternative browser.
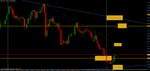
Order Update
Stopped @ 1.2709 on EUR/USD short from 1.2670
Open Positions
USD/JPY long half position from 87.80, stop @ BE
GBP/USD short half position from 1.5235, stop @ BE
Open Orders
EUR/USD
Buy @ 1.2730, 75 pip stop
Buy @ 1.2530, 75 pip stop
USD/JPY
Nothing close
GBP/USD
Buy @ 1.5325, 100 pip stop
Sell @ 1.5005, 60 pip stop
dominationFX
Member
- Messages
- 91
- Likes
- 3
Excellent posts, FXAJ and trader-dante. I have ignored lagging indicators, in favour of Price Action, so S/R and TL are right up my street as a newbie to Forex. Apart from t_d and james16, who else on T2W is a good PA authority to learn from, please? -
If I'm honest history is the best place to learn from. You can trade trendlines, fibs, support & resistance in many different ways but nothing beats back-testing and pouring over the charts than actual trading. For me the biggest problem beginners have is confidence in their method. Without confidence you will be tempted to tweak and change things as your beliefs about the market are open to external influence, they aren't rooted. Once you have your method refined and your rules are fairly mechanical start trading a demo account for 3 months. If that goes well trade say 25% of your capital for another 3 months. Keep adding from there. If you follow a method that is more discretionary you'll probably struggle.
To build your method pull up a 10 year history in MetaTrader for GBP/USD. The more data the better. Devise a method based on what you know, and apply the rules religiously to each signal on that 10 year history. Capture all the trades along with screenshots showing entry, drawdown and exit in a spreadsheet. You'll need to shift down to lower timeframes to ensure you didn't get whipsawed out of a move where a candle spans your entry and stop. Analyse the trades - where's the best place to put your stop? did you move your stop too quickly? would a trailing stop to BE help? how should you move your stop? are there obvious places to take profit? does trading with the trend help? how extended is the market when you enter a trade? which signals are the best performers? are you comfortable with the drawdown on your given risk profile? how long do the drawdowns or barren periods run for? Also factor in slippage and financing. Now do this again for the other majors. I know it takes time but nothing else will give what you need. If you've already read some of TD's thread and J16 then you already know enough. Stop looking any further.
Some notes about how I trade. I've found that trailing my stops to BE doesn't really improve my results (very marginally) but it does reduce my drawdown. I've also found that taking profit at 1 or 2 * risk reduces my drawdown, which I'm more comfortable with, but in the long run it significantly reduces my profit. That's just my psychology and what suits me. I thought I would give riding the drawdown a go when I started this journal but after a 11% drawdown in the first 3 weeks of June I quickly slipped back into what I would term aggressive trading! Note that by taking profit early I am actually trading two methods. One method has reduced drawdown and reduced profits (but is more consistently profitable) the other method has exceptional profits but drawdown in the region of 35-40% at 2% risk during barren trading periods. I don't want to post past results in this journal as I don't want to make it look like I'm cooking the books. After a few more months I'll have enough data to begin to demonstrate these effects.
So, there is little more you need other than a starting point and time. I think TD describes support and resistance very well along with price action. I don't trade price action as it doesn't have an edge and thus requires discretion / confirmation, which TD highlights well. For trendlines you can try short term trends or 1-2-3 entries in the direction of the trend and a trailing bar or trailing swing stop. Here are some example threads -
http://www.forexfactory.com/showthread.php?t=54528
http://www.forexfactory.com/showthread.php?t=80290
I haven't read many threads that offer excellent advise but it's usually only the first 2 or 3 pages you need to read. There are no secrets in this industry only those with patience and discipline and those without.
I'll throw this out there too. Forex is the most liquid market in the world. More $$ are moved in Forex than all the stock markets in the world combined. There isn't anyone here who couldn't devise a profitable strategy on EUR/USD daily timeframe. Whilst the large speculators (hedge funds) have the leverage to move the market over shorter timeframes the vast majority of the time it's central banks, governments, global banks, regional banks, large funds and large multinationals that are moving the market for other reasons than pure speculation. This appears on the daily, weekly and monthly timeframe. They have nothing against you or me and they are not out to get the retail punter so there is nothing to stopping anyone from becoming a trader. Even captial can be aquired with a good track record if you look hard enough.
Wow, that post was longer than I inteded it to be!
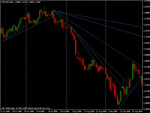
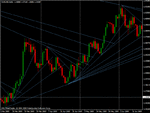
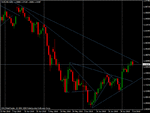
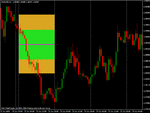
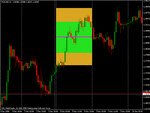
To illustrate backtesting I've draw how I see the trendlines since the start of the financial crisis to date - 2 years of data. Hopefully the rules I use to determine a trendline become reasonably clear. Note that this is simply how I would draw them, others would draw different lines.
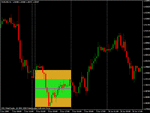
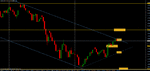
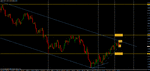
If you now take each of these lines at the break point and drill into the 1H timeframe. Draw a horizontal line across the day at the point the trendline would be on the daily chart. Then add in a range, e.g. 1/2 or 1 * the ATR for the past month or so. I've illustrated this for the 08 December 2008, 08 & 15 June 2009 trendlines. I've deliberately picked a couple of lines that challenge my methodology. For example using a half ATR stop on 08 Dec 2008 I missed a huge move where a 1 * ATR stop would have kept me in. 08 and 15 June also show the effect of using 1 or 1/2 an ATR stop. These are the parameters of your methodology that you must define. You must stick to your rules religiously. Getting stopped out is part of the game - move on to the next setup.
It takes time to backtest. At best around 40 hours for a single ccy pair over 10 years of data. More like 120+ hours to get the most out of it. You'll see different things to me depending upon your bias but you should be able to come up with a profitable way of trading.
Once you have your rules approximately defined you can backtest using some of the tools available to MT4. Basic backtesting could be to simply hit F12 and progress through each daily bar or you could use something like vHandsTrade (google it). There is other simulator software out there. Backtesting helps improve your skill at executing your strategy. You should still forward test for a couple of months.
The only thing remaining is position sizing. Look up the topic and you'll find plenty of information on it along side expectancy.
Attachments
-
 eurusd june 2008 to march 2009.gif17.8 KB · Views: 166
 -
 eurusd march 2009 to november 2009.gif21.8 KB · Views: 169
 -
 eurusd november 2009 to july 2010.gif17.9 KB · Views: 165
 -
 08 june 2009 1h drilldown.gif17 KB · Views: 158
 -
 15 june 2009 1h drilldown.gif19.8 KB · Views: 166
 -
 08 december 2008 1h drilldown.gif19 KB · Views: 174
Sunday Orders - 11 July 2010
Open Positions
USD/JPY long half position from 87.80, stop @ 87.80
GBP/USD short half position from 1.5235, stop @ 1.5235
Open Orders (will wait until the market opens)
EUR/USD
Buy @ 1.2720, 75 pip stop
Buy @ 1.2530, 75 pip stop
Sell @ 1.2455, 75 pip stop
USD/JPY
Buy @ 90.05, 40 pip stop
Buy @ 87.35, 60 pip stop
GBP/USD
Buy @ 1.5310, 100 pip stop
Sell @ 1.5030, 60 pip stop
Attachments
GBP/USD short from 1.5030, stop now at BE. I'll hold until the GDP numbers before taking any profit. Note that I'll also go long @ 1.4825 with a 100 pip stop should we get there.
I'll move the USD/JPY stop to 88.20. It reacted this morning to the 38.2 from the recent swing.
I'll also move my GBP/USD stop to 1.5090 on short from 1.5235.
I'll move the USD/JPY stop to 88.20. It reacted this morning to the 38.2 from the recent swing.
I'll also move my GBP/USD stop to 1.5090 on short from 1.5235.
Choppy action today. USD/JPY and GBP/USD positions from last week came within a few pips after moving my stops today. GBP/USD short @ 1.5030 in and out in a flash.
Open Positions
USD/JPY long half position from 87.80, stop @ 88.20
GBP/USD short half position from 1.5235, stop @ 1.5090
Open Orders (will wait until the market opens)
EUR/USD
Buy @ 1.2690, 75 pip stop
Buy @ 1.2530, 75 pip stop
Sell @ 1.2455, 75 pip stop
USD/JPY
Buy @ 90.00, 40 pip stop
Buy @ 87.40, 60 pip stop
GBP/USD
Buy @ 1.5255, 100 pip stop
Sell @ 1.5155, 100 pip stop
Note that all stops are trailing to break even.
Open Positions
Long EUR/USD half position from 1.2530, stop @ 1.2610
Long EUR/USD from 1.2690, trailing 75 pip stop currently 1.2667, order to take half off @ 1.2765.
Short GBP/USD from 1.5155, trailing 100 pip stop currently 1.5242
Open Orders
EUR/USD
Sell @ 1.2455, 75 pip stop
USD/JPY
Buy @ 89.90, 40 pip stop
Buy @ 87.40, 60 pip stop
GBP/USD
Buy @ 1.5245, 100 pip stop
Similar threads
- Replies
- 18
- Views
- 5K
- Replies
- 2
- Views
- 3K
M
- Replies
- 0
- Views
- 2K