You are using an out of date browser. It may not display this or other websites correctly.
You should upgrade or use an alternative browser.
You should upgrade or use an alternative browser.
- Status
- Not open for further replies.
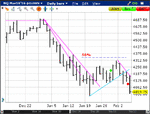
As no one has shown any interest in the DAX, CAC, FTSE or other non-NQ charts that I've posted (most recently, post 34, above), I won't be posting any more of them. Not that I'm crushed or anything, but I do have other uses for my time.
Before leaving this topic, however, I do want to point out that anyone who is interested in the FTSE and who also took the time to bone up on the SLA and saw the FTSE charts I posted above (again, post 34, reposted below) would have enjoyed a 330pt move. This is not a matter of "hindsight trading" but of understanding how a mean-reverting instrument behaves in an auction market.
Db
Db,
I would be interested in seeing charts of CL or LCO as that is what I have been following and observing. Not sure if you do too. I haven't really been online much and don't really follow the FTSE or the DAX so I didn't comment previously, but I am in the same time zone so it's possibly something worth following for me.
Thanks
dbphoenix
Guest Author
- Messages
- 6,954
- Likes
- 1,266
Db,
I would be interested in seeing charts of CL or LCO as that is what I have been following and observing. Not sure if you do too. I haven't really been online much and don't really follow the FTSE or the DAX so I didn't comment previously, but I am in the same time zone so it's possibly something worth following for me.
Thanks
I've posted charts of CL and Brent but there's been no interest so I stopped doing it. But I'll post new ones. By "LCO" I assume you're referring to Brent?
I've posted charts of CL and Brent but there's been no interest so I stopped doing it. But I'll post new ones. By "LCO" I assume you're referring to Brent?
Yes Brent Oil, LCO is the symbol used on investing.com.
Thanks Db, I will post my observations too to see if I am on the same line of thought.
dbphoenix
Guest Author
- Messages
- 6,954
- Likes
- 1,266
These are quickies, not templates. Their purpose is to provide the context for where we are.
I know that many people scalp these for reasons I've never really understood, but I don't post intraday stuff unless I know the person is in a position to watch the chart live, which is relatively rare (most are trying to daytrade while working).
Db
I know that many people scalp these for reasons I've never really understood, but I don't post intraday stuff unless I know the person is in a position to watch the chart live, which is relatively rare (most are trying to daytrade while working).
Db
Attachments
dbphoenix
Guest Author
- Messages
- 6,954
- Likes
- 1,266
Screenshots of CL charts I annotated last week. After a quick comparison to yours I think I'm possibly adding too much in the way of lines and S/R levels. I will scale it back and keep it more simple.
People commonly focus on lines rather than on what buyers and sellers are doing and when and where and how, the latter of course being the whole point of Wyckoff, on which the SLA is based.
So if you don't understand why I drew the lines that I drew, just ask.
And if you haven't been reading the W thread, you should begin. It's closed in order to keep it as brief as possible, but you can always ask questions about it here if you're trying to combine the two (anyone who isn't is welcome to ask questions about W via PM to me).
Db
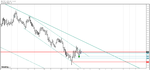
Quite an active morning for europeans again...
I see three options to catch the move:
1. BO (+RET)
2. Entry after DB and break of the supply line (9:24)
3. Entry after the RET (9:46)
Apart from entry 1 I see no reason to exit so far. The midpoint of the 60M range could be interesting...

I see three options to catch the move:
1. BO (+RET)
2. Entry after DB and break of the supply line (9:24)
3. Entry after the RET (9:46)
Apart from entry 1 I see no reason to exit so far. The midpoint of the 60M range could be interesting...
dbphoenix
Guest Author
- Messages
- 6,954
- Likes
- 1,266
Quite an active morning for europeans again...
I see three options to catch the move:
1. BO (+RET)
2. Entry after DB and break of the supply line (9:24)
3. Entry after the RET (9:46)
Apart from entry 1 I see no reason to exit so far. The midpoint of the 60M range could be interesting...
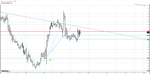
These moves are taking place earlier and earlier, this time 0200, which is fine if you're in Russia or India, not so much in the West.
In any case, when you see a launch like that, the RET is generally a very low-risk place to enter. Even the test of it can be a low-risk entry (in this case, an hour later, still awfully early, though not so much in Europe). After that, price ranges until 0440, and one can take the first RET after the BO, but the longer one waits, the less likely price is to go anywhere and the more likely it is to roll over. Sellers run out of buyers. Information risk vs price risk.
But all of this is counter-trend. As long as the daily trend is intact, the upside is more likely to be less than the down. This is not to say that the counter-trend trade shouldn't be taken. There is after all the possbility that the CT trade one has taken will be the one to break the downtrend and sail off into the wild blue yonder. But it pays to be realistic and trade what one sees, not what one hopes to see.
Db
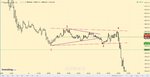
DB, have you ever found any use in using mirror-inverted lines?
There was an example yesterday and also today just half an hour ago during the EU morning session.
So basically one is anticipating a hinge by drawing the line between 1 and 2 applying it at 3 - like any other channel but with a mirror-inverted angle.
This gave point 4 and also the always important equilibrium level.

Needless to say that one could have also waited for a BO below 2 and short the RET - which would have been wise maybe. There was also a RET entry on the 1M after the fall from 4 at the midpoint...
There was an example yesterday and also today just half an hour ago during the EU morning session.
So basically one is anticipating a hinge by drawing the line between 1 and 2 applying it at 3 - like any other channel but with a mirror-inverted angle.
This gave point 4 and also the always important equilibrium level.
Needless to say that one could have also waited for a BO below 2 and short the RET - which would have been wise maybe. There was also a RET entry on the 1M after the fall from 4 at the midpoint...
Last edited:
Gring0
Well-known member
- Messages
- 264
- Likes
- 128
DB, have you ever found any use in using mirror-inverted lines?
There was an example yesterday and also today just half an hour ago during the EU morning session.
So basically one is anticipating a hinge by drawing the line between 1 and 2 applying it at 3 - like any other channel but with a mirror-inverted angle.
This gave point 4 and also the always important equilibrium level.
Needless to say that one could have also waited for a BO below 2 and short the RET - which would have been wise maybe. There was also a RET entry on the 1M after the fall from 4 at the midpoint...
Lines are something that is in our heads. No matter where we draw them it's the change in behaviour that alerts us to the potential of a change in stride. As far as mirror lines are concerned, I would think trading ranges, especially the diagonal ones, are a form of mirror lines. Despite this we still pay attention to the behaviour itself rather than whether a line is precisely approached. If price is unable to reach the other end and begins to show signs of turning we accept that for what it is. We note the imbalance between demand and supply and to the fact that one side wasn't able to push the other to the other end.
I would think that having lines that are not representative of what price is doing, and are there only because of aesthetics, have the potential to lead a trader into disregarding WHAT IS to a mindset of what SHOULD BE. Price moves in so many ways that no matter where we draw a line it's likely to eventually give us a few instances where that particular case of drawing yields the best and most telling outcome.
We as traders do adjust the lines. In case of a hinge when the behaviour shows (after the fact) that price is turning from a higher level we can draw another supply line or re-adjust the first one. The point is to put in context the current behaviour. The difference in both is slight. The danger in one is that 'hope' might take over the mind in anticipation of what ought to be. That change in perception is the biggest threat to a trader using price behaviour for decisions making. I have been guilty on many occasions to trade my perceptions of the market and not the market itself, leading to confusion and disorientation. Sticking with What Is is serving me better now. In the end there are no absolute answers. You might find that mirror lines are a better fit for the way you think. After all, it's all in our minds.
Gringo
p.s. Another thing to note is whether one chooses the supply line first to mirror a demand line or a demand line first? In case of this hinge both the supply line and the demand line for the hinge between points 3 and 2 are actually formed first (not shown in your chart). Had one been trading live one wouldn't know in advance that two wider swing points were in the offing until price did show that behaviour. This may be an indication of drawing lines in hindsight instead of making decisions in real time. (See attached chart)
Attachments
Last edited:
I would think that having lines that are not representative of what price is doing, and are there only because of aesthetics, have the potential to lead a trader into disregarding WHAT IS to a mindset of what SHOULD BE. Price moves in so many ways that no matter where we draw a line it's likely to eventually give us a few instances where that particular case of drawing yields the best and most telling outcome.
Thanks. Yes I absolutely agree. This kind of thinking or sticking to ones believes can be very distractive.
Was just an observation. As its character is per se not hindsight, the question is if it can be from worth..
dbphoenix
Guest Author
- Messages
- 6,954
- Likes
- 1,266
Gringo is correct. I don't actually draw these lines in trading; I draw them to illustrate what I see. What I see in trading is the higher low and the lower high and the middle between them. I then see that price drops Xpts below this line then an equivalent above it, at which point it reverses. I may have provided examples of this at other sites. In other words, I'm more concerned with what traders are doing than on what kind of line I can draw.
Db
Db
dbphoenix
Guest Author
- Messages
- 6,954
- Likes
- 1,266
Thanks. Yes I absolutely agree. This kind of thinking or sticking to ones believes can be very distractive.
Was just an observation. As its character is per se not hindsight, the question is if it can be from worth..
To begin with, thank you for engaging the material and asking questions about it. This is how one achieves success with this or any other approach, even if it's trading MACD divergences.
But as for your comment about it being "wise" to wait for the RET below the hinge, not necessarily. The longer one waits, the more price risk he assumes. The entry is at that point where supply overwhelms demand, and this is at the reversal off the top of the hinge (I should point out that none of this is in the pdf but rather the book, so this entire exchange belongs in the Notes thread). This is the core of trading price, those levels and points where these shifts take place. And if they take place at important points or levels, such as the reversal off the SL yesterday morning or the reversal off the top of this hinge today, then the trade has a higher probability of success than a trivial reversal off nothing especially important in the middle of nowhere (see the Wyckoff thread, particularly those charts which show where Wyckoff traders enter vs where pattern traders enter).
People will spend $7000 (or more) to learn how to detect these shifts. Or one can sit in front of a streaming chart with a notebook and a pencil and begin observing price movement. The latter is cheaper, but it's not for everyone.
As for the pdf vs the book, the pdf focuses on weekly, daily, and hourly intervals, and, as I posted yesterday in the Notes thread, the last two days represented a RET with a short entry below yesterday's low. Not only has price triggered that but also an entry placed below the previous day's low.
Db
Edit: A 5s chart is posted in the other thread.
Last edited:
But as for your comment about it being "wise" to wait for the RET below the hinge, not necessarily. The longer one waits, the more price risk he assumes. The entry is at that point where supply overwhelms demand, and this is at the reversal off the top of the hinge (I should point out that none of this is in the pdf but rather the book, so this entire exchange belongs in the Notes thread). This is the core of trading price, those levels and points where these shifts take place.
Thanks DB.
Actually it was a try to locate those points in advance. Apart from ranges and midpoints I sometimes find them hard to locate - or trust. Like the SL bounce from yesterday.
But if one has located those, one has to zoom in to a very microscopic view to see the shift at or as close to the level as possible.
What would indicate that shift for you? A break of a line, the failure to make higher high or lower low? A break down in this case and a springboard?
The other question is if the move to a located level itself carries meaning - I mean of course it does. But in this case it was grinding upwards on the way to 4 and was struggeling to make a HH and then failed rapidly.
Sorry if that is the wrong location for that discussion.
Edit: Sorry, just saw that you edited your post. Please feel free to move or delete this post if necessary.
dbphoenix
Guest Author
- Messages
- 6,954
- Likes
- 1,266
Thanks DB.
Actually it was a try to locate those points in advance. Apart from ranges and midpoints I sometimes find them hard to locate - or trust. Like the SL bounce from yesterday.
But if one has located those, one has to zoom in to a very microscopic view to see the shift at or as close to the level as possible.
What would indicate that shift for you? A break of a line, the failure to make higher high or lower low? A break down in this case and a springboard?
The other question is if the move to a located level itself carries meaning - I mean of course it does. But in this case it was grinding upwards on the way to 4 and was struggeling to make a HH and then failed rapidly.
Sorry if that is the wrong location for that discussion.
Edit: Sorry, just saw that you edited your post. Please feel free to move or delete this post if necessary.
See this post.
Most people will never make this adjustment, either because they're not interested or because they can't. But even in the latter case, they will still profit from the SLA if they follow the rules because that's how it's designed.
Db
dbphoenix
Guest Author
- Messages
- 6,954
- Likes
- 1,266
dbphoenix
Guest Author
- Messages
- 6,954
- Likes
- 1,266
In regards to the line break value you defined, would you recommend a manual trailing of the stop? I mean just in terms of a kind of fixed SLA approach...
The line break value is only one of many that can be used, particular if one is taking some other instrument out for a test drive. This particular value comes from Livermore. But it has less to do with the SLA than it does with the test of the stride. In other words, the test of the stride is there whether one has drawn any lines or not.
Db
- Status
- Not open for further replies.