Stochastic oscillator

julesrules

Member
Messages
60
Likes
0
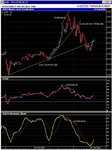
In my continuing trader education i looked into the Stochastic oscillator. I am amazed i really am, for the last 20 mins i have been laughing at the screen and myself, Stochastic oscillator is so good. taking into account i only learnt it about 30 mins ago here are my recent paper trades.
Just on the DOW assuming 2 point spread either way

Position Bought Sold Profit
Short 8069 8062 +5
Short 8056 8047 +7
Short 8054 8046 +6
Long 8049 8059 +8
------------------------------------------
Total= +26
------------------------------------------
what does everyone else think to stochastics?
 
in my opinion yes,
although i have only been doing it for 30 mins etc..
i will continue paper trading and have a look at the results

do you use stochastics?
 
Someone have already mentioned using Stochastics and getting rather good results from it. I can't remember where I have read it though- but I have been trying it myself using the slow Stochastics rather than the fast one and things are looking rather good so far. Obviously we will need to get feed back from someone who has been using it for a long period of time to give us a fully picture.
 
Hi JR,

All indicators "work" to an extent. I personally think if you get to know an indicator well enough you can build a profitable system round it. But you need to really know and understand it.
For example, which sort of markets does it work best in? Trending/Sideways? What do it's movements mean in relation to price movements/range. Can you trade its patterns/trends? Make sure you understand how it is calculated too, that will help you decide how helpful it will be in certain situations.


I personally use CCI but after about six months of using it I think I probably only know a fraction of how it really works, it takes a long time to get to know any indicator really well. If you think you have a feel for stochastics then go for it :) Trading is a very personal thing. I know a trader who makes a very nice living trading a stochastics based system but he has been using it for about 4 years and can see things in it that I can't :)


Cheers
 
Hi JR

I have been using the slow stochastics for about a year in combination with RSI and MACD. I use 5 and 15min charts.

:) It works extremely well in sideway moving stocks but not so well with fast trending stocks. Hence the use of other indicators.

I don't think one should rely on just one indicator. I for example use 4 in addition to S/R, patterns and other trading tactics.

Here's a screenshot of AZN today.
 

Attachments

  • astra2.jpg
    astra2.jpg
    115.7 KB · Views: 909
Last edited:
Stochastics

Julesrules

I too have been looking at stochastics after it was mentioned on another thread. What set up do you have? I've been using slow stochastics 25, 3 and 25, 3, 3. Results are ok so far, but looking to incorporate it with other indicators. You seem to be making a lot of trades in one day. I suppose If they're mostly profitable who's complaining.

Thanks

Dave
 
i use slow stochastics the trades below were made just with slow stochastics. However as i am new to technical analysis i am currently looking in to MACD.

Todays trading history (paper trading four point spread)
Spreadbet History
Index Position Bought Sold Profit/loss (points)
FTSE Short 3732 3726 4
FTSE Short 3722 3721 -1
DAX Short 2701 2693 6
FTSE Short 3720 3719 -1
FTSE Short 3721 3716 3
FTSE Long 3716 3724 6
FTSE Short 3728 3724 2


Total 19

Just waiting for the DOW to open, so i can start on the DOW & NASDAQ. On average i spot a trend on the stochastic and hold on to it for approx. 5 mins sometimes if i hold on to the trade i can make more but i prefer to make a lot of small gains instead of changing small gains into small losses.
 
julesrules...do you enter the trade when stochastics
are in the 70..30 range.....or soon as you a cross
 
i wait until they cross and the two lines diverge if they show signs of continuing to diverge i enter the trade.
 
e.g. from about 5 mins ago the line had just crossed i waited for signs of further divergence a min later they had so i went short at 3717 2 mins later i closed the position at 3712.
 
Hi JulesRules,

Can you say which market you just traded and what chart timeframe ie 1min, 5 min etc ?

Cheers


Paul
 
Was this the FTSE future or Index ? The reason I ask is that the future is much more volatile than the index and the index can only be traded with a SB company ?


Cheers


Paul
 
Here is an interesting article I found some time ago which describes combining Stochastics with MACD.

http://www.futuresmag.com/library/daytrade97/day7.html

I think the key line from the text is ...

"Throw these indicators up on any chart together, and you will see this combination works infinitely better than either indicator alone. "

I have made up a 'Study' in Sierra Charts based on what's described in the article and it seems to work well in all timeframes.
 
Watch out for indicators, especially if you are 'new' to using TA methods and don't have the basics of chart reading sorted out. Otherwise I guarantee you will blow cash at an alarming rate, especially switching from paper to real trading.

FWIW
 
Hi gpegler,

A bit cheeky, I know, but any chance you could make your Sierra charts 'study' available for downloading ?

Regards,
 
Top