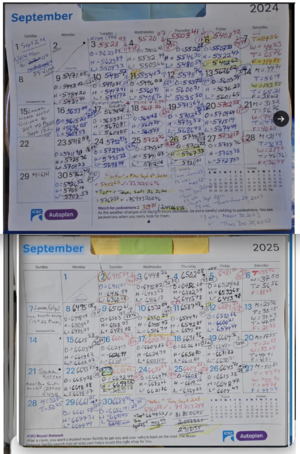
SPX :: YEAR 2 0 2 6 [monthly data/daily]

S P X -- Month of MAY 2026
**NOTE: the 7599.38 = 7568.72 on the "7.8125" factor grid
Jan - May 2026 data
1780274409808.png
1780274481995.png
 
S P X ...

LAST June 2025 ...the "bottom" for that month was on MONDAY June 2, 2025...and the "TOP" for JUNE 2025 was MONDAY June 30, 2025 @ 6215.08 -- some pundits thinking we hit the 6200 area...hmmm
..also check the $VIX : $VXV -- the >0.91 ...the BEARS in charge
1780763619403.png
1780763636470.png
1780763713757.png
1780763726678.png
 
S P X the POWER of P.U.T.S. -- with today's spread @ 245.30 -- basically Fri (173.78) + Mon (71.68) = 245.46
"TOP" TUES June 2 @ 7620.90√ = 87.297766
'bottom' tues √ 9 @ 7237.85√ = 85.075554
SPREAD: 383.05 | 2.222212 .....so far

& LOOK @ today's Open 74(38).66 --> 'switch' and one gets 74(83).15 as today's day high and looking @ the 7.8125 grid -- the 7483.15 area below = 7436.6025 MINUS 200 points = 7237.85 area / today's day low...and OBSERVE the DAILY spreads -- add/subtract them next day and voila -- like magic -- they APPEAR to add. hard to articulate.
1781062573115.png
 
S P X -- **NOTE**** today's Open + Day Low of 7516.75 ==>> 2TD back...a THURSDAY -- basically 2TRADING WEEKS back -- a THURSDAY, JUNE 4th, 2026
Open 7516.54 & Day Low 7516.54 ...and TODAY's Close of 7554.29 => WED June 3rd Close of 7553.68 area.
on WED June 3rd Day High = 7605.35 -- SAME as THAT day's Open price
on THUR June 4th Day High = 7598.19 = .27% from TODAY's Day High of 7577.92
BASED on MY "7.8125" Factor #GRID --
7522.54 +/- 31.25 = 7553.79* close to TODAY's Close of 7554.29 and WED June 3rd Close of 7553.68 | 7491.29

7522.54 +/- 54.6875 = 7577.275* close to TODAY's Day High of 7577.92 | 7467.8525* LAST Monday June 8th Day High area of 7466.81 !!

BASED on 7585.04 (page 5 of the #grid) +/- 7.8125 = 7592.8525 | 7577.2275**
√ √ +/- 15.625 = 7600.65 | 7569.415** THURS May 28, 2026 Day High area of 7568.72

√ √ +/- 31.25 = 7616.29 (?) MAYBE this weeks high / retest of TUES June 2nd, 2026 "TOP" of 7620.90 | 7553.79

 
today's new FOMC dude being showcased -- and S P X dropped 129.56 (spread between day day - day low) ---->>> that's like LAST WEDNESDAY, June 10th spread of 130.63.
question is -- will we see June 11th spread of 155.35 TOMORROW -- a THURSDAY ? 😉
1781733545264.png
1781733577391.png
1781733609196.png
 
S P X :: many "worried" about Monday-Monday...June 29th, 2026 😉
anyhow -- 1st the data -- next...I asked AI -- via google to confirm some stuff. thought I'd share it here. I know majority of traders just use AI and don't bother doing any type of calculations. that's like relying solely on GPS and nothing else. don't know how you got there (your destination) lol
1782618546885.png
1782618572557.png
1782618587978.png
 
F O M C -- Wed JULY 29th, 2026 -- similar to WED June 17, 2026 as to SPX spread !!!

NOTICE ? ... many got fooled with the intra-day low of around 7341-42 area around NOON / 12 pm ET / 9 a.m. PT ... that is basically YESTERDAY's (Tuesday July 28th Close @ 7428.78√ (squared) = 86.19037 +/- 7428.78 = 7514.9703 | 7342.5897** ALSO one should ALWAYS calculate by 1.272% the close / open / day high / day low besides SQUARING the prices. NOTICE ? that YESTERDAY's Day High of 7452.09 was being RETESTED today at 7450.84.

don't have time & inclination to take screenshots right now of THIS month's data -- will do so by EOW. the PUTS -- the lows were when it hit the DAY HIGH...and NOTICE ? the difference IF one bought yesterday -- they basically didn't make the $$$ one could have when DAY HIGH got hit.
I MANUALLY write the DAILY spreads -- but INSTEAD of taking screenshots/re-writing down the #FOMC spreads ...got Google's AI to give me since 2020 to today.
1785380964302.png
1785380981386.png
1785381021931.png
 
Back
Top