BuddieBuddiee
Active member
- Messages
- 177
- Likes
- 7
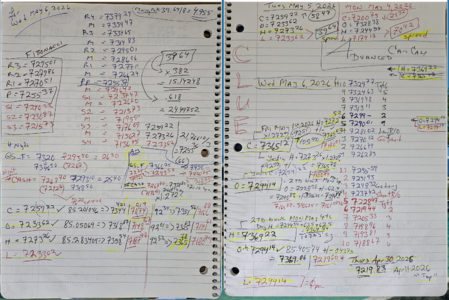
YEAR 2024 -- daily data


S P X -- see HOW the "7.8125" FACTOR / 62.5 works ? did today. lolS P X -- NOTICE ? the 7272.52 made today = 7147.54 / ANOTHER Friday made on April 17th, 2026 Day High 7147.52
7210/7209 | 7085/7084 etc etc
am visual person -- just had a "conversation" with #grok on "x" and gave "Claude"AI some simple calculations. lol
View attachment 346674