Spreadbetting Journal – Trend Strategy

S&P Volume

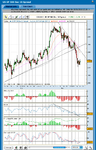
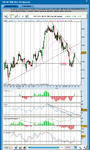
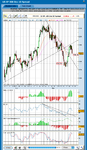
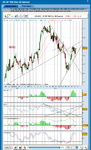
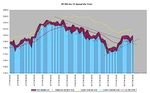
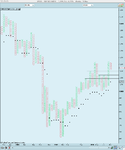
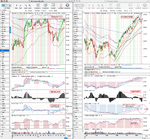
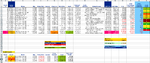
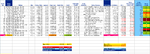
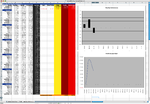
I’ve been having a look at my weekly and daily charts and have noticed that volume doesn’t seem to be accompanying this down move over the last few weeks. Force Index hasn’t crossed it’s 22 day SMA yet and volume on the weekly chart is low still and hasn’t seen much of a pick up on the selling. So unless some major selling volume starts coming in, I think I’m going to start looking for long positions again, as this move down is looking more like a pullback. Key support on the weekly chart looks like the two year downtrend line to me. I think if this holds then a possible wave 5 begins with any luck. But we’ll see, as the market will probably do the opposite.
 

Attachments

  • SP500_17-11-10.png
    SP500_17-11-10.png
    145.8 KB · Views: 685
Re: S&P 500 Long Entry

The selling in the S&P 500 looks to have stalled to me, so I’m trying for a swing trade here. I may possibly sell at the downtrend line if it gets there and looks weak. Have a big stop on this one at 0.5%, as I’m willing to let it swing down as far as the 100 Day EMA, as I still think this is corrective period and am hedged with the VIX so should make out about even if it does.

Trade
SP 500 Dec 10 Spread
Entry Price: 1177.7
Qty: 0.5
Spread: 0.6

Stop: 1137.4
Limit: 1223.6

Account Risk: 0.5%
Potential Account Profit: 0.56%
Risk Ratio: 1.14

The S&P 500 has moved up above the downtrend line and a good distance from my entry price, so I’ve moved my stoploss to breakeven.

Entry and current charts are below.

The stop loss is a bit high for my liking as a retest is possible, but hopefully it will run higher first and I’ll see a chance to exit at a better price.
 

Attachments

  • SP500_4hr_17-11-10_entry.png
    SP500_4hr_17-11-10_entry.png
    30.8 KB · Views: 178
  • SP500_4hr_18-11-10_1145.png
    SP500_4hr_18-11-10_1145.png
    30.2 KB · Views: 173
S&P 500 Long Exit – Dec 10 Spread

The retest seems to have begun. I moved to using a 4 hr safezone stop yesterday which moved my stop up to 1188.2. The stop was hit at 14.53, but has pulled back above it now. The MACD histogram and RSI both suggest further downside to me and I think we are going to retest the recent low. Below is the closing trade info.

Closing trade
Entry Price: 1177.7
Exit Price: 1188.2
Qty: 0.5 per point
Points: 10.5
P/L: £5.25
Trade Percentage: 0.89%

Daily Channel Captured: 14%
Trade Grade: C

Account P/L: 0.13%

My original thoughts last week were that this is an ABC correction. So it is possible that this is now the C part, which I think can be as big as the A part. So that would suggest a 50 point move down from the recent pivot high to the 1150 area on the Dec 10 Spread. Or it could bounce in the 1170 to 1180 area and start an new run higher. I think I’ll wait and see a bit before getting back in.
 

Attachments

  • SP500_4hr_19-11-10_1505.png
    SP500_4hr_19-11-10_1505.png
    30.6 KB · Views: 174
S&P 500 Long Entry – Dec 10 Spread

Trade
SP 500 Dec 10 Spread
Entry Price: 1199.2
Qty: 0.5
Spread: 0.6

Stop: 1191.8
Limit: 1225.6

Account Risk: 0.09%
Potential Account Profit: 0.32%
Risk Ratio: 3.57

Final trade for the week is a long entry in SP 500 Dec 10 Spread at 1198.6. I waited till the close to see if the S&P could close higher than last week on the weekly chart. It just made it, so I decided to add a long position to play a possible move up on Monday.

I spent some time this week creating a manual intra-day chart with the Dec 10 Spread 4hr data from the charts. Tedious, but worthwhile, as I now have an 4hr chart with Keltner channels for targets and 4hr safe zone stops, which are much better for short term trades and take all the guess work out of initial stop placement. I’ve played around with the settings of the safe zone stop and have got a much smaller number of 0.75 as the setting on the 4hr charts. It won’t ride any pullbacks like a bigger setting like 2.5 would, but should maximise profits on short term moves higher.
 

Attachments

  • SP500_4hr_19-11-10_2114.png
    SP500_4hr_19-11-10_2114.png
    31.6 KB · Views: 177
  • SP500_4hr_19-11-10_keltner.png
    SP500_4hr_19-11-10_keltner.png
    48.6 KB · Views: 177
Last edited:
Weekend Update

Below is the my updated weekly spreadsheets and also a weekly point and figure chart of the S&P 500.

I had a fairly flat week. Down -0.07% from last weeks close. I had some average grade winning trades, and one minor loss, which got a D grade as it lost 5% of it’s daily channel. The winners gained 5% and 14% of their daily channel, so only a C- and a C grade for those. My position in the VIX rolled over into the next month, so closed and reopened. The closed trade captured 17% of it’s daily channel so earned a C grade as well.

Current open positions are the VIX Dec 10 Spread and SP 500 Dec 10 Spread.
 

Attachments

  • SP500_PF_Weekly_19-11-10.png
    SP500_PF_Weekly_19-11-10.png
    21.3 KB · Views: 191
  • Account_spreadsheet_19-11-10.png
    Account_spreadsheet_19-11-10.png
    5.2 KB · Views: 195
  • Trades_spreadsheet_19-11-10.png
    Trades_spreadsheet_19-11-10.png
    20.2 KB · Views: 522
CA Inc (CA) Dec 10 Spread – Entry

Trade
Entry Price: 2310.3
Qty: 0.32
Spread: 9

Stop: 2392.2
Limit: 2215.0

Account Risk: 0.64%
Potential Account Profit: 0.75%
Risk Ratio: 1.16

I joined Spiketrade this week and this was what I chose as my first trade. R/R is bad at the moment, but saw it rolling over after the initial spike up today and thought it wasn’t going to hit my original target of 2365, so chose to get it at market. The attached chart has my technical reasons for the trade.
 

Attachments

  • CA_Spikepick-21-11-10.png
    CA_Spikepick-21-11-10.png
    133.5 KB · Views: 184
Account Update

I’ve been away for a few weeks, so hence the lapse in the journal entries. I only had one open trade when I left which was the VIX. In hindsight I should have hedged this by opening a position in the S&P 500 before I went away. But I didn’t and the recent rally has stung the VIX, so I lost around 1% while was away. Am currently at 2.44% in the account, so 1.03% down before I’ve even had a chance to trade this month because of the holiday and not being able to access my spreadbetting account from New York. So by my rules I’ve only got 0.47% risk left as my limit is a 1.5% loss in a month. I’ve hedged this by opening a position in the SP 500 Dec Spread on Fridays close. So is going to be challenging this month with so little risk to play with, but I still think i can turn it around.
 

Attachments

  • Trades_spreadsheet_3-12-10.png
    Trades_spreadsheet_3-12-10.png
    27.9 KB · Views: 459
  • Account_spreadsheet_3-12-10.png
    Account_spreadsheet_3-12-10.png
    8.7 KB · Views: 397
Weekend Update

I couldn’t get a handle on the direction this week. The market looked like it was going to breakout, then it looked like it was going to breakdown and now it looks like the breakout is back on again. I closed out my losing VIX position on tuesday as it had used up two thirds on my monthly risk, so I thought I needed to take the loss and then try to recover some of it with my remaining 0.5% available risk. However, I lost confidence in my long S&P 500 positions and listened to too many outside sources opinions on direction when I should have just stuck to my system with the safezone stops for protection. My open S&P 500 short position is now very close to being stopped out and will mean that I can’t open any new trades this month if it gets hit as I will have used my maximum 1.5% drawdown.

Below is my trades spreadsheet and a new monthly performance spreadsheet with charts.
 

Attachments

  • Trades_spreadsheet_10-12-10.png
    Trades_spreadsheet_10-12-10.png
    20.3 KB · Views: 451
  • Monthly_Performance_10-12-10.png
    Monthly_Performance_10-12-10.png
    58.7 KB · Views: 210
Re: Stock Watchlist

I’ve been thinking about a new strategy that I’d like to trial. It’s a breakout strategy that looks for stocks that are breaking out above long term resistance of their previous highs. The thinking behind this is that once all previous resistance levels are cleared, then the stock is in a price discovery phase, with only technical resistance at Fibonacci levels and general market down swings to combat. As the majority of people in the stock are making money, so have less reason to sell.

So I’ve used my buy signal indicator and scanned the market to find stocks in a current uptrend and then filtered out the ones that hadn’t cleared their previous highs, and finally I filtered out the ones with bad balance sheets. Below is what I’ve got left.

Amec (AMEC)
Antofagasta (ANTO)
Ashmore (ASHM)
Bhp Billiton (BLT)
Blackrock Wld (BRWM)
Domino's Pizza (DOM)
Fresnillo (FRES)
Hargreaves Lans (HL.)
Halma (HLMA)
Hochschild (HOC)
Petrofac (PFC)
Premier Oil (PMO)
Schroders (SDR)
Spirent (SPT)
Talvivaara (TALV)
Wellstream (WSM)

I thought as I can no longer trade anymore this month, due to my max drawdown of 1.5% being hit, that I should go back and see how the breakout portfolio was doing. So far it seems to be doing ok at up 4.29% since Nov 8th. The S&P 500 opened at 1223.24 on Nov 8th and is currently around 1246, which is up 1.86%. So the breakout stocks are doing 2.43% better so far which is promising, but far too early to judge anything. I will let this one run and see how it develops and maybe trade some of the stocks that continue to perform well.
 

Attachments

  • Picture 44.png
    Picture 44.png
    171.7 KB · Views: 160
Top