Soybeans - Long Term

DaveT

Well-known member
Messages
434
Likes
6
Any views on where soybeans are headed on 2004?

There was a lot of money to be made on the run up this year.

I am closely following the fundamentals; the market cannot tolerate any S.America/ 04 US weather problems re. SUPPLY.

China remains the key re. DEMAND - -trade delegation in US currently.


Technically, the long term charts still look good to me.

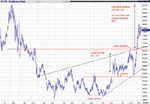
On the weekly chart attached , I see a RISING WEDGE reversal with an eventual objective of 922.
I have also drawn the 50% RETRACEMENT level of the AUG - NOV rally, which could act as support on a shorter term decline.

Note how the 2001 DOUBLE BOTTOM objective was eventually met in '03; again not before a 50% RETRACEMENT of the 2002 rally.

Any thoughts?
 

Attachments

  • soybean weekly.png
    soybean weekly.png
    39.1 KB · Views: 768
Hello David,

I agree with you that the longer term outlook is UP for this market. The demand will remain strong, especially from China.
We have to be careful though in the shorter term, not to read too much in the recent agreement by the Chinese buyers delegation to purchase 2.5 MT and maybe another 2.5 MT later. The Chinese are known to make big announcements to buy, drive up the prices on the back of the speculators, short the market, and then cancel the orders. They pulled this regularly in the wheat markets.

Best regards, and good trades !
Andreas
 
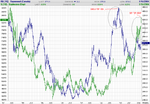
I notice a strong intermarket correlation between SOYBEANS and CANOLA.

Take a look at the chart attatched. SOYBEANS appear to lag the CANOLA chart by 1-2 years....

Fundamentally, they are quite separate - CANOLA is mainly grown in CANADA and therefore at the mercy of the weather there, (I think). Soybeans, ofcouse, being grown in US and BRAZIL.

Does this portend a top within the next few weeks/months? If the chart correllation continues, SOYBEANS could retrace most of the 2003 rally this year. ( say 78.6% FIBBONACCI ?)

As a Technical Analyst, I view INTERMARKET ANALYSIS as another valuable tool. I was reading an article yesterday about an analyst who has spotted an exact correlation between the S&P and the NIKKEI -

ie. S&P 2000-2005 BEAR is charting EXACTLY as NIKKEI 1990-1995 BEAR, turn-for-turn, making this current equities bull run no more than an obvious bear market rally, which should end soon....

For specific timing of entry/exit, you need daily charts, ofcourse, but I always consider it important to get as broad a view of the BIG PICTURE as possible.

Any thoughts?
 

Attachments

  • canola vs soy wkly.png
    canola vs soy wkly.png
    46.1 KB · Views: 729
For anyone interested, I have copied the article here.. (hope that's OK)


Dear Daily Reckoning reader,

Stock analysts often say that "When Wall Street
sneezes, the City catches a cold."

Well watch out, Britain! Because the US has caught
the flu - Japanese flu to be exact.

Japanese investors have been stuck in a bear market
for almost 14 years now. The parallels between how
they got there – and how Wall Street has suffered
since the Bubble of 1996/2000 – are eerie, to say the
least...

** Between 1971 and 1985, the Japanese stock market
went up about 500 per cent.
** The US bull market began 10 years later – and from
1981 until 1995, US stocks went up 500 per cent.
** In 1985, the Japanese market really took off –
tripling in the next 5 years. In 1995, the US market
really took off – tripling in the next 5 years.
** In 1990, the Japanese market peaked out and
started to fall. Eighteen months later, it was down
some 30 per cent.
** In 2000, the US market peaked out...and 18 months
later it was off some 30 per cent.

Spooky, don't you think?

But the parallels between Tokyo and Wall Street don't
end there...

Thirty-one months after the Nikkei peaked in 1990, it
bottomed at 14,194. It then rallied 50% over the next
13 months – before tumbling again.

Over on Wall Street, ten years later, the S&P 500
topped out at 1,552 in March 2000. Thirty-one months
later, it bottomed at 768. Over the following 14
months, it has rallied 47% to its current level.

This is more than coincidence. And if the parallels
hold from here, the prognosis for US stocks – and for
British investors who want to avoid catching the flu
– doesn't look good.

"The S&P's rally will end any day now," wrote Eric
Fry, our New York editor, on Tuesday. With America's
New Year reporting season almost upon us, you might
think Eric was making a pretty safe call.

But Eric predicts "the index will tumble about 24%
between now and April." His forecast is based on this
parallel with the Tokyo Nikkei - which is still
proving so painful to Japanese investors, 14 years
after it peaked.

"The Nikkei didn't rally by 50% just once," explains
Eric. "It launched three distinct 50% rallies...

** In 1995-6 it soared from 14,000 to 22,000, exactly
like the 1992 rally.
** Then, from late 1998 to 2000 it jumped 50% from
13,000 to 21,000...
** Before collapsing to 7,600 in April of last year."

It could never happen on Wall Street, of course. The
global economy's "single engine" is now reporting
plenty of positive numbers. Egged on by Dubya's tax
cuts and Greenspan's E-Z credit bubble, US investors
are piling back into the markets. The optimists are
sure they will triumph.

But Japanese investors felt just the same optimism
every time the Nikkei staged a rally. Even when it
crashed, they clung to hope like a flu victim
clutches his hot water bottle.

In September 2000, the Japan Times interviewed a 30-
year old stock investor from Saitama. Mr Nakamura had
watched his equity investments lose 500,000 yen in
just 9 months – equivalent to £31,850 in 2000 terms.
Yet Nakamura-san was still undaunted:

"The loss doesn't shock me," he told the paper. "I
actually wish I had more money now, because this is
the best time to buy stocks."

Bright guy. Reminds us not a little of today's bulls
on Wall Street and in the City.

And so we ask: Is today the best time for you to buy
stocks, dear reader? We doubt it – for reasons that
go far beyond the spooky stock index parallels we've
just described.

Japan also offers a scary insight into America's
future demographics – the "aging population" which
every commentator accepts will make economic recovery
even harder in the months and years to come. The
effects of this demographic shift on stock market
values is something we believe hasn't been explored
anywhere but in our new book, "Financial Reckoning
Day".


If you want to learn more about how the US economy is
"turning Japanese" – plus what you can do today to
protect yourself from the fallout in British shares
when it does – then we urge you to read it for
yourself today.

Because if the Dow Jones does chart a course
identical to the Nikkei's, it will fall to 8,000 by
this coming spring...on its way to 2,400 in April
2014.

That's some sneeze, dear reader, and Britain will
catch a very nasty cold.
 
Not too sure I see that Canola and Soybeans are that closely related .. just from looking at that chart they can go in completely opposite directions buy a long way and can range over several years! I am too impatient (and profit/loss sensitive) to wait that long. I am very small long of Soybeans after this breakout from 800 .. will stop out if goes a bit below 800.
Peter
 
Thanks PeterTT,

My point about CANOLA/SOYBEANS similarity is really about the general pattern of prices since bottoming in 2000/2001 - ie., a breakout of downtrend, consolidation sideways-to-lower, then a sharp run-up, consolidation, etc

Just an observation...

.
 
I think that when considering relationships between canola and soybeans it is good to have an appreciation of crush margin. The real demand will come from the crusher who ultimately makes money by selling the meal and oil. Many plants can switch between soy and canola depending on the relative margin. Same goes to a smaller extent with Sunflower oil although the seed is much more a physical market. I spent some years trading soybean and products and worked very closely with the crushers all they look to do is to maximise their margin and hedge out as much risk as possible. With this in mind a cyclical relation between these products makes sense.
 
Canola weekly chart

Hi

hope no-one mnds my joining this thread but im inclined to agree with PeterTT. I follow canola, soybeans and other commods reasonably closely and whilst there are times when they move in unison - im convinced they operate entirely in their own cycles.

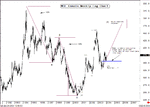
Anyway i've attached a canola weekly chart EW analysis which if correct then we might expect canola to take off before year end unless it breaks below the target shown. :?:

Rgds
GWD


*Nothing in this posting or any attachment is intended to be a trading recommendation in relation to any market and as such is given purely as my own interpretation and is for information purposes only*
 

Attachments

  • canolaweekly.gif
    canolaweekly.gif
    24.5 KB · Views: 534
Very interesting to read the above dialogue on Canola vs Beans. Forgive my inexperience but where can I find the canola contract. my boker doesn't seem to offer it. Is it a liquid contract? thanks
 
RE: SOYBEANS:

AVIAN BIRD 'FLU (a strain of) has been found in Deleware , USA.
Beans down 20 in overnight trading.

www.agweb.com

Multi-nation ban on US poultry. This could hurt feed/meal demand further?

Monthly Supply/Demand report out Tuesday. Further adjustments?

VERY VOLATILE trading conditions. My position at the moment?

STAND ASIDE!!! Until clear trend re-develops.
 
Soybeans

Thanks for news link.

Price pattern for S H4 points to potentially bearish set-up. Last week's recovery failed (thusfar) to make new highs. Friday trading was a Doji and if in todays' trading price reverse down from current 837, it could develop in a doji star.

I may be going short should prices drop on momentum weakness below 8334, Thursday's highs with a stop just above Fridays' high (say 8450), targetting below 800 (7260 is .382 retracement of the Aug-Jan rally!)
 
ok, that was not a good strategy, too speculative, should have waited to nearer to the close.
I hear that "funds" continue to be piling up: they bought another 2600 contracts on the day!!
 
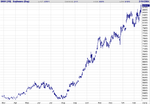
Nice break up today out of 850 top area .. I am long from a few weeks ago (March contract) and managed to buy some more (May contract) on Wednesday evening. Not certain yet but will probably add if there is some correction lower (860 ish) tomorrow.
 

Attachments

  • fscom.png
    fscom.png
    13.3 KB · Views: 337
Well, my first long-term objective of 922'0 WEEKLY SOYBEANS has been surpassed.

Now the old Bull flag on the WEEKLY chart suggests 1046'0 or so...

Trust Brazil to have a weather problem!!
 
Top