Solid ECN | Professional Market Analysis | *Video*

SOLIDECN

Senior member
Messages
2,800
Likes
0

AUDUSD

23.12.2021

audusd-forum banner.png


Today we review the Australian dollar against the US dollar on MetaTrader 5 platform.

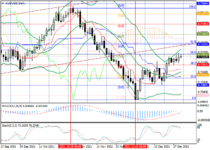
The pair downside movement from February higher high slowed down in December, and as of analyzing, the AUD USD is trading around 0.72 area. The bears went off-road in their latest push to race the bulls away from the ascending channel. The vital support at 0.699 successfully holds the selling pressure so the Bulls can start biding and drag the race away from the last support standing.

From a technical standpoint, the MACD indicator shows both the divergence and the crossover signals, forecasting a trend reversal or a sideways market. Considering the 0.699 is the key to halting the further decline, the Australian dollar may target 0.755 as its first checkpoint.

Zooming out to the AUD USD weekly chart. The 0.699 is the key support. With a break of this threshold, bears road to checkpoint 0.669 will be paved.

Solid ECN statistics show that the bulls are hoping for 0.755 with the risk at 0.695, and the bears are more optimistic by having their bids on 0.6673.​


Please note that foreign exchange and other leveraged trading involve a significant risk of loss. It is not fit for all investors and you should make sure you realize the risks involved, seeking independent advice if necessary.
 

USDCAD

23.12.2021​

forum banner - usdcad.png

Welcome to Solid ECN Market Analysis, today we will be looking at USD-CAD pair on the weekly and daily chart on our MetaTrader 5 platform.

The pair is currently trading around the pivot of 0.918. The bull's pressure was capped by the ascending trendline, which is valid since April 2019. The ascending trendline showed strength five times already. The battle between bears and bulls from 0.875 has formed a triangle, and the market is being squeezed as this report is published.

Minor Support levels are:
0.908
0.901

The main support levels are:
0.892
0.875

The downside movement started from 0.937 would probably ease at 0.908. With the hold of this level, the USD would have another leg extending to the upper side of the wedge at 0.93, and then we should wait for market behavior after hitting the ascending trendline for the sixth time.

From a technical standpoint, the failure of the 0.9086 support, signals the resumption of the CAD powering against the USD. In this scenario, the bear's path to the checkpoints at 0.892 and 0.8757 will be paved.

The market may influence by hedge funders, and there is a possibility of erratic movement. Please consider this risk before entering a trade on the new year's holiday.​


Disclosure: Please note that foreign exchange and other leveraged trading involve a significant risk of loss. It is not fit for all investors and you should make sure you realize the risks involved, seeking independent advice if necessary.
 
EURUSD | GBPUSD | USDJPY
27.12.2021​


Today we will be looking at euro dollar, GBP USD, and USD JPY weekly and daily charts.

The Euro Dollar downside momentum from 1.226 eased at the Fibonacci 61.8 level near 1.118. The candles formed a "bullish Doji star" and a "hammer" pattern forecasting an upcoming trend reversal. The pattern can be spotted in the daily chart. Indicator-wise, the MACD shows a divergence in the trend. So far the outcome of the MACD divergence was the trend decline slowing down around 1.118 and moving sideways. Minor resistance exists at 1.138. With a break of this fragile sealing, the instrument would probably target 1.15. On the other hand, we'll witness more decline in the pair if the support at 1.118 fails.

GBP USD bounced from the 38.2 retracement level of the Fibonacci, and it is trading close to the minor support at 1.341. With a breach in the said level, the pound sterling surge to 1.366 would probably be seen in the next few days. 38.2 Fibo at 1.3158 is the conservative support. If this level breaks, the next target would be level 50 of the Fibonacci retracement around 1.225.

If you find the content useful, please subscribe to the channel and hit the link button.

USDJPY
The bulls have an outstanding performance against the bears on the JPY USD pair. Buyers didn't cute their pressure on passing the resistance at 114.4, and the market is on its way to test the sealing for the fifth time in the last 10 days. Support is at 111.66. As long as this level holds, the market trend is bullish. Resistance is at 115.53, with a break of the level, the path of the bull to 118.66 will be paved.​


Please note that foreign exchange and other leveraged trading involve a significant risk of loss. It is not fit for all investors and you should make sure you realize the risks involved, seeking independent advice if necessary.​
 

Gold

29.12.2021​


forum_banner.png


Today we are looking at the gold 4 hours chart.

The yellow metal breached the $1814 resistance yesterday, but the bulls couldn't hold the price above the said level. The instrument is trading near the 23.6 Fibonacci retracements. The upward trendline from December 22, and December 27 failed to keep the bullish sentiment.

Below the $1800 support is level 50 of the Fibonacci. If this minor support fails, the path to $1784 will be paved for the bears.

Trading Signal
The trend is bullish, and minor resistance will be seen from the bears here and there.
Solid ECN statistic shows that the buyers' target is $1830 and $1850 checkpoints with the risk of stopping at $1784.

On the other hand, the bears are targeting $1784 with risking the December higher high at $1820.


GBP/USD​


lower volatility is a catalyst for price correction
30.12.2021

gbpusd 30122021.png

The British currency is gradually adding in value against the background of lower volatility and is currently correcting upward around 1.3487.

The country continues to occupy a leading position in terms of the incidence of the Omicron strain. According to the National Health Safety Agency (UKHSA), the number of confirmed cases of the new mutation currently exceeds 210K, and the day before, the highest daily number of COVID-19 infected since the beginning of the pandemic was recorded at 183,037.

Meanwhile, the energy crisis continues to develop in the UK, as a result of which 26 companies have already filed for bankruptcy amid an unprecedented rise in wholesale prices for gas and electricity. The leaders of the industry's leading enterprises have asked the government to reduce the value added tax rate for them, and, according to preliminary information, the meeting will take place on January 3.

The American currency is at the previous levels, showing no trading activity. Perhaps tomorrow's data on the number of Initial Jobless Claims will be able to change the situation. According to analysts, the figure may rise to 208K from 205K a week earlier, and the total number of beneficiaries may rise up to 1.868M people. Even in the case of fixing changes, this is unlikely to have a serious impact on the dollar quotes, since most of the large positions on the asset were liquidated last week.

Support and resistance
GBP/USD is trading within the global downtrend channel, approaching the resistance line. Technical indicators are holding a local buy signal: the fast EMAs of the Alligator indicator are above the signal line, and the histogram of the AO oscillator is trading in the buy zone, forming ascending bars.

Support levels: 1.3362, 1.3170.
Resistance levels: 1.3566, 1.3850.​

gbpusd_30122021.png


AUD/USD

The potential for further growth may be limited

audusd_forum_banner.png

The AUD/USD pair has been showing upward trading dynamics since the beginning of this month and is currently testing the 0.7263 mark.

The strengthening of the position of the trading instrument was the result of rising commodity prices, as well as some easing of restrictions on Australian exports from China. In particular, Beijing adjusted quotes for the supply of wool from Australia by 5%, so next year producers will be able to increase the volume of production to 40K tons instead of the current 38K tons. This decision confirms the opinion of a number of Australian experts that China will not be able to completely abandon Australian raw materials, even in conditions of serious political tension.

Further strengthening of the Australian currency remains in question, as the country is experiencing a serious surge in the incidence of coronavirus caused by the Omicron strain. The number of infected citizens is increasing, and many of them have to be isolated, which creates problems for doing business. The authorities even had to weaken the testing criteria in order not to exclude a sufficiently large number of Australians from economic life. Thus, further deterioration of the epidemiological situation may well lead to new quarantine restrictions in early 2022.

As for the US currency, its position also does not look stable, since in the USA the incidence is growing at a record pace, which may lead to new economic restrictions. Today, investors are waiting for the publication of data from the labor market. In the event of a significant increase in the number of initial applications for unemployment benefits, the dollar may adjust downward, as it becomes clear that the Omicron strain has begun to put pressure on the American labor market.
Support and resistance

The key level for the "bulls" remains 0.7263 (Murray [3/8], Fibo retracement 50.0%), the breakout of which will give the prospect of further growth to 0.7325 (Murray [4/8], Fibo retracement 61.8%) and 0.7385 (Murray [5/8]). If the price is fixed below 0.7200 (Murray [2/8], Fibo retracement 38.2%), the decline will be able to resume in the area of 0.7140 (Murray [1/8]) and 0.7080 (Murray [0/8]). The indicators do not give a single signal: the Bollinger Bands are directed upwards, but the Stochastic leaves the overbought zone, forming a sell signal.

Resistance levels: 0.7263, 0.7325, 0.7385
Support levels: 0.7200, 0.7140, 0.7080​

audusd_30122029.png
 

EUR/USD​

Market uncertainty persists​


The EUR/USD pair has been trading in the sideways range of 1.1350-1.1230 (Murray [2/8]-[0/8]) since the end of last month.

Investors remain less active on the eve of the New Year and monitor the dynamics of the incidence of coronavirus infection caused by the Omicron strain. At the moment, the authorities of the USA and European countries are trying to minimize restrictive measures, trying to prevent their impact on the national economy and not cause a new negative reaction among the population. Nevertheless, the update of daily anti-records against the background of an increase in the number of infected COVID-19 around the world makes experts sound the alarm. So, in the USA, the daily incidence has reached its highest during the entire pandemic, which levels the weakness of Omicron and increases the shortage of personnel at enterprises, limiting business activity.

Under these conditions, it is quite possible to expect that local authorities will go to tighten quarantine after the New Year holidays, since it is sanitary measures that will help significantly contain the spread of the virus. Today, data on initial applications for unemployment benefits will be published in the USA, which will illustrate the impact of the pandemic on the labor market. In case of an increase in the indicator, the US currency may be under pressure.

As for the euro, its position is also unstable, since the situation with morbidity in the eurozone countries is similar to the American one. The indicators are growing, which may cause the introduction of new quarantine measures. It should also be noted that recently there is an opinion among officials of the European Central Bank (ECB) that inflation in the eurozone may be higher than the regulator's forecasts. The negative dynamics should serve as a driver for an additional reduction in economic incentives, but concrete decisions in this direction from the ECB in the near future probably will not follow.

Support and resistance
In the near future, the price of EUR/USD is highly likely to remain in the range of 1.1350-1.1230. If the level of 1.1290 breaks down (Murray [1/8], the middle line of the Bollinger Bands), the decline of the trading instrument will continue to 1.1230, after which the growth may resume to the upper limit of the 1.1350 channel. The indicators do not give a single signal: the MACD histogram is decreasing in the negative zone, but the Stochastic has reversed down.

Resistance levels: 1.1350, 1.1413, 1.1475.
Support levels: 1.1291, 1.1230, 1.1170, 1.1100.​

eurusd_30122021.png
 

Crude Oil: Wave Analysis​

True ECN Broker from Traders for Traders

crude oil_wave analysis_forum banner.png

The price is in a correction; a fall is possible.

On the daily chart, the upward wave C forms, within which the first wave 1 of (1) of C developed. Now, a downward correction has started to develop as the wave 2 of (1), within which the wave a of 2 is formed. If the assumption is correct, the price will fall to the levels of 54.10–44.25. In this scenario, critical stop loss level is 77.56.​

WTI Crude Oil_wave analysis_1.png

WTI Crude Oil_wave analysis_2.png


Open a free account today
www.solidecn.com
 
Last edited:

Trade eBay with Solid ECN​

True ECN Broker

eBay_forum banner.png

Current trend
The stocks of eBay Inc. are strengthening from the 7-month low of December 20, adding more than 5.5%. The decrease in the issuer's quotes from the October 52-week high was 18%, but over the past week, the trading instrument regained some of the lost positions and showed a rise in value by 2.48%, while the S&P 500 index added 0.85%.

In Q2 2020, eBay Inc. had about 161M active shoppers, and by Q1 2020, their number increased to 166M. People worldwide tried to avoid shopping in stores and turned to online trading platforms. However, with the recovery of the global economy after the lifting of quarantine restrictions on retailers, indicators began to deteriorate significantly. So, as of Q3 2021, the number of active buyers on the company's platform decreased to 154M people, and over the past few quarters, the cost of transactions of eBay Inc. fell from $21.7B to $19.4B. Nevertheless, the issuer managed to show positive statistics on profit (during the same time, it rose from $2.2B to $2.5B) due to an increase in the percentage of each sale. In general, traffic on the online platform increased from 9.7% in Q3 2020 to 12.1% in Q3 2021, which is undoubtedly a positive result.

To retain audiences, eBay Inc. made another strategic decision – to focus on more valuable customers. For example, previously, such users were sent a 15% discount coupon of the total purchase amount every quarter, encouraging them to make a purchase. At the moment, management has largely abandoned this practice, as marketing expenses fell to 18.8% in the last quarter, up from 22.3% last year. Interestingly, declining promotions could be another reason for eBay Inc.'s customer losses mentioned earlier.

Support and resistance
The shares have stabilized, and at the moment, the quotes are consolidating. There is no unidirectional trend observed. The key range is 63.00–68.50. There is potential for further correction. Indicators do not give accurate signals: the price consolidated between MA (50) and MA (200), MACD entered the positive zone. It is better to open the positions from the key levels.

Comparative analysis of multiples of the company and competitors in the industry indicates the neutrality of the asset.

Support levels: 63.00, 58.00, 55.00.
Resistance levels: 68.50, 72.00, 76.50​

ebay.png
 
Last edited:


AUD/USD​

Positive statistics support the instrument​


Current trend
The AUD/USD pair trades above the level of 0.7158, supported by the macroeconomic statistics.

Thus, the number of preliminary building permits in Australia rose by 3.6%, despite the forecast of 3.2%. The previous value was revised downward to –13.6%. Investors expect the November retail sales data to be released tomorrow at 02:30 (GMT+2). According to forecasts, it will amount to 3.9%. Positive economic data from Australia temporarily restrain the trading instrument from further decline, leaving a chance for the "bulls" to break through the level of 0.7265.

Additional support to the asset was provided by publishing data on the US labor market last Friday. December Nonfarm Payrolls amounted to 199K against the forecast of 400K, but the previous figure was corrected upward from 210K to 249K. Unemployment decreased again and amounted to 3.9%, although analysts had forecast a decline of 0.1% to 4.1%.

On the other hand, Australia is starting to vaccinate children aged 5–12 years after the number of infections increased significantly on New Year's holidays, exceeding 116K cases per day. The virus forces Queensland to postpone its annual school reopening by a month until early February. The epidemiological situation is worsening, although politicians cite positive scientific studies on the effect of the Omicron strain on mortality to maintain optimism. For a while, it may support buyers of the Australian dollar, but given the planned rate hikes by the US Federal Reserve in 2022, the pair's growth looks limited.

Support and resistance
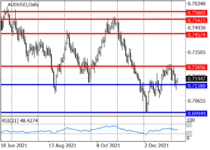
The long-term trend is downwards. In December, the pair gained support at 0.6995, after which it started an upward correction, within which it tested the resistance level of 0.7265. If this level is held, the fall will continue with the target at the December low.

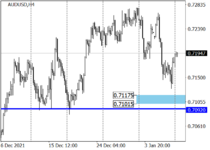
The medium-term trend is upwards towards the target zone 2 (0.7329–0.7313). Last week, the price corrected, approaching the key support for the trend around 0.7117–0.7101. After the test of key support, it is worth opening long positions.

Resistance levels: 0.7265, 0.7457, 0.7541.
Support levels: 0.7158, 0.6995, 0.6830.​

audusd_analysis_1.pngaudusd_analysis_2.png


USDCHF​

Investor Interest in the USD is Growing​


Current trend
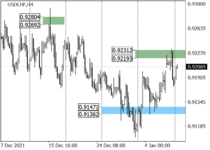
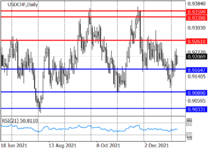
The inability of the "bears" to renew the November lows and the return to the support level of 0.9165 act as catalysts for the resumption of the uptrend in USD/CHF. Weak data on Nonfarm Payrolls in the US in December could not radically change the situation in the asset, because even before their publication, the quotes set new lows around 0.9090, and instead of continuing to fall, the instrument again grows above the level of 0.9165.

The number of jobs created in the US non-agricultural sector in December amounted to 199K against the projected 400K. The decrease in the indicator can be attributed to the seasonal factor and the Christmas holidays. In turn, Unemployment Rate in the United States fell from 4.2% to 3.9% with the forecast of a decline to 4.1%.

The long-term trend in USD/CHF remains upward. The first target is the resistance at 0.9261, but the main point for the "bulls" movement is the November high at 0.9360. The key support is at 0.9089.

As part of the medium-term downtrend at the end of last year, traders reached target zone 2 (0.9147–0.9136), after which the price went into correction. Now the instrument is trading near the key resistance of the trend at 0.9231–0.9219 and, if it is held, the target of the decline will be at the December low. If the resistance is broken through, the priority for trading will change to an upward one.

Support and resistance
Resistance levels: 0.9261, 0.9339, 0.9360.
Support levels: 0.9165, 0.9089, 0.9033.​

usdchf_1.pngusdchf_2.png
 

BTC is losing ground amid events in Kazakhstan​


Current trend
Last week, the BTC/USD pair continued to decline and tested the level of 41000.00.

The instrument was pressured by two negative factors – the publication of the minutes of the last meeting of the US Federal Reserve, filled with the “hawkish” rhetoric, and the events in Kazakhstan. In the minutes of the American regulator, it was noted that it could start raising rates earlier than planned, as the factors of inflation growth in the country persist. Experts believe that the first increase may take place in March, and the December positive data on the US labor market only strengthens confidence in this. The prospect of an imminent tightening of monetary policy puts pressure on alternative assets, including digital ones.

Events in Kazakhstan, where more than 18% of the world's cryptocurrency mining is concentrated, led to a decrease in the activity of large mining pools and a decrease in the BTC hash rate by 12%. Currently, the situation is normalizing, however, the first cryptocurrency does not receive the necessary support to restore lost positions.

Support and resistance
The key “bearish” level is 41000.00. Its breakdown allows further decline to 37500.00 (Murrey [–2/8]). The breakout of 43750.00 (Murrey [–1/8]) allows growth to 46400.00 (middle line of Bollinger bands) and 50000.00 (Murrey [0/8]). The continuation of the decline seems more likely since the reversal of Bollinger bands downward and the increase in the MACD histogram in the negative zone indicate that the downtrend continues. Stochastic's exit from the oversold zone does not exclude an upward correction but its potential seems limited.

Resistance levels: 43750.00, 46400.00, 50000.00.
Support levels: 41000.00, 37500.00.​

btcusd_technical analysis.png
 

Gold​

Traders Prefer Bonds​


Current trend
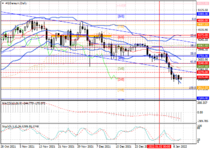
Gold quotes continue to trade near the psychological level of 1800.0, correcting in a downtrend. Serious fluctuations in the asset are unlikely in the near future.

Investors are awaiting concrete action from the US Fed, and the movement in XAU/USD is likely to begin after the start of the interest rate hike cycle. The change in the volume of the quantitative easing (QE) program does not have a strong impact on the price of the precious metal, so traders will wait for more serious drivers to appear, leaving part of their capital in bonds, which now show a higher yield than gold. For example, since January 1, the yield on 10-year US bonds has grown from 1.512% to 1.765%, and gold quotes during this period have decreased from 1830 to 1792 dollars per ounce.

According to the Commodity Futures Trading Commission (CFTC), the number of investor positions in gold last week fell to 211.4K from 213.2K a week earlier. This distribution confirms the fact that there are now much more interesting assets for investors than metals, which have not actually changed the current trend since last summer.

Support and resistance
On the daily chart, the price is trading within the global sideways channel, moving towards the lower border. Technical indicators are ready to reverse and give a signal for the start of sales: fast EMAs have reached the signal line with a readiness to cross it, and the histogram of the AO oscillator is forming descending bars, quickly approaching the transition level.

Support levels: 1770.0, 1725.0.
Resistance levels: 1831.0, 1870.0.​

gold_technical analysis.png
 

USD/JPY​

US labor market report disappoints the market​


Current Trend
The USD/JPY declines, trading around 115.81. Also to poor macroeconomic statistics, the asset is negatively affected by the introduction of new coronavirus restrictions in some prefectures of Japan.

The areas of Okinawa, Hiroshima, and Yamaguchi had the highest number of new cases of infection, and the authorities decided to restrict the operation of catering establishments and public events. The head of the Japanese Doctors' Association, Toshio Nakagawa, announced the sixth wave of the epidemic in the country. On Thursday, for the first time since mid-September, 4.475K infected people per day were detected. Also, the Household Expenditure Index declined by 1.3% YoY for November, with an expected growth of 1.6%, and declined by 1.2% MoM after rising by 3.4% for the previous period.

USD didn't take full advantage of the JPY weakness, as the report on the US labor market disappointed investors. Although the unemployment rate for December fell to 3.9% from 4.2% for November, Nonfarm Payrolls increased by only 199K, with an expected increase of 400K. Private Nonfarm Payrolls rose by 211K, below the projected 365K people, too. The number of jobs in the manufacturing industry also was worse than expected – 26K against 35K forecasted.

Support and resistance
The instrument is correcting upwards, trying to consolidate above the global high of the year. Technical indicators maintain a stable buy signal: indicator Alligator's EMA fluctuations range expands upwards, and the histogram of the AO oscillator forms new upward bars in the buy zone.

Resistance levels: 116.34, 118.00.
Support levels: 114.83, 112.70.​

usdjpy_technical analysis.png
 

USD/JPY Wave Analysis​

The pair may grow.
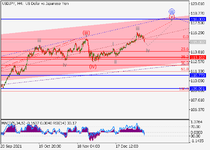
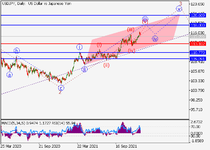
On the daily chart, the third wave of the higher level 3 of (1) develops, within which the first wave of the lower level i of 3 formed, a correction developed as the second wave ii of 3, and the third wave iii of 3 develops. Now, the third wave of the lower level (iii) of iii has formed, a local correction has ended as the wave (iv) of iii, and the fifth wave (v) of iii is developing. If the assumption is correct, the pair will grow to the levels of 118.00–120.60. In this scenario, critical stop loss level is 113.10.​

usdjpy_wave analysis_11122_#1.pngusdjpy_wave analysis_11122_#2.png
 

XAG/USD Elliot Wave Analysis


The pair may grow.

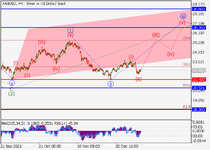
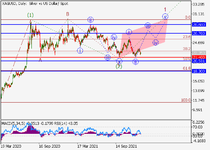
On the daily chart, the first wave of the higher level (1) of 3 formed, a downward correction developed as the wave (2) of 3, and the development of the third wave (3) of 3 started. Now, the first wave of the lower level i of 1 of (3) has formed, a local correction has developed as the wave ii of 1, and the formation of the wave iii of 1 has started, within which the development of the wave (iii) of iii has started. If the assumption is correct, the price will grow to the levels of 26.76–28.68. In this scenario, critical stop loss level is 21.40.​

silver_wave analysis_1.pngsilver_wave analysis_2.png
 

EURUSD Technical Analysis​


Current trend
The European currency shows moderate growth against the US dollar during the Asian session, continuing the development of flat dynamics in the short term.

The day before, EUR/USD showed a rather active decline, which was caused by a short-term strengthening of the American currency, which is supported by the expectations of an imminent increase in interest rates by the US Fed. Last week, the regulator released the minutes of its last meeting, which demonstrate "hawkish" rhetoric. Representatives of the department noted the negative effect of the continuing growth in consumer inflation, as well as the still tense situation on the labor market. In 2022, the regulator may increase the rate 3 or more times, and the first adjustment may occur as early as March, subject to the acceleration of the curtailment of the quantitative easing (QE) program.

Monday's macroeconomic statistics from the eurozone provided little support to the euro. Sentix Investor Confidence in January rose from 13.5 to 14.9 points against the forecast of a reduction to 12 points. The Unemployment Rate in the region in November, as expected, decreased from 7.3% to 7.2%.

Support and resistance
Bollinger Bands in D1 chart demonstrate flat dynamics. The price range is almost unchanged, but it remains rather spacious for the current level of activity in the market. MACD indicator is growing preserving a weak buy signal (located above the signal line). Stochastic keeps its upward direction but is rapidly approaching its highs, which reflects the risks of overbought EUR in the ultra-short term.

Resistance levels: 1.1363, 1.1400, 1.1422, 1.1460.
Support levels: 1.1329, 1.1300, 1.1255, 1.1220.


ETH/USD, Technical Analysis


Current trend
Last week, ETH/USD continued to decline and reached four-month lows around 3125.00 (Murray [2/8]), while leaving the descending channel. Further movement of quotations is likely to continue to the levels of 2812.50 (Murray [1/8]) and 2500.00 (Murray [0/8]).

In general, the downtrend in the asset remains, which is confirmed by the downward reversal of Bollinger Bands and the increase in the MACD histogram in the negative zone; however, the reversal of Stochastic from the overbought zone does not exclude an upward correction. In case of a breakout of the lower border of the descending channel in the area of 3270.00, the trend is likely to change to the levels of 3540.00 (Fibonacci retracement 61.8%, the center line of Bollinger Bands) and 3750.00 (Fibonacci retracement 50.0%, Murray [4/8]). Nevertheless, a decline in quotations is the most likely scenario at the moment.

Support and resistance
Resistance levels: 3270, 3540, 3750
Support levels: 3125, 2812, 2500​

ethusd_technical analysis.png
 

Key Releases​


United States of America
The US currency is strengthening against the yen today and has ambiguous dynamics paired with the euro and the pound.

Investors are waiting for today's speech by the head of the US Fed Jerome Powell in front of the Committee on Banking, Housing and Urban Affairs of the US Senate. It is expected that before approving his candidacy for the post of head of the US regulator for a new four-year term, Powell will answer questions from Senators who will be interested in the measures taken by the US Fed to combat high inflation. Thus, Powell can clarify the further steps of the regulator in the field of monetary policy. Currently, it is believed that the beginning of the rate hike may begin as early as March, and not in the summer or at the end of the year, as previously thought. Moreover, Goldman Sachs experts expect four increases at once during the year. In general, Powell's comments can cause a significant market movement.​

Eurozone​

The European currency is strengthening against the yen today and has ambiguous dynamics paired with the USD and the pound.

In the absence of significant economic releases, the attention of European investors is focused on the comments of representatives of the European Central Bank regarding the high inflationary pressure on the European economy. It should be recalled that in December, the consumer price index in the eurozone countries increased by a record 5.0%. Today, the head of the regulator, Christine Lagarde, said that she understands the concerns of citizens about high prices, and confirmed that they can trust the ECB in solving this problem. According to her, the bank stands for price stability, which is crucial for fixing inflation expectations and confidence in the currency. ECB Chief Economist Philip Lane said the ECB still does not expect inflation to exceed the 2.0% target in the medium term. The new governor of the German Bundesbank, Joachim Nagel, noted that the price increase may continue longer than expected. In general, European officials have not yet specified new ways to combat inflationary pressure.​

United Kingdom​

The British currency is strengthening against the yen today and has ambiguous dynamics paired with the USD and the euro.

December retail sales data from the British Retail Consortium (BRC) was published today. On an annualized basis, sales increased by 0.6%, which is better than market expectations (0.3%), but worse than the November growth of 1.8%. In general, BRC specialists are skeptical. They believe that retail trade will face significant pressure this year, as consumer spending will be restrained by rising inflation, an increase in energy bills and a tax increase coming in April. It should be noted that the British government is trying to mitigate inflationary pressure on the economy. Thus, The Times newspaper reported that the Ministry of Finance of the United Kingdom is considering the possibility of reducing the "green levy", which is levied on electricity consumption, in order to slow down the increase in prices in the energy market.​

Japan​

The Japanese currency is weakening today against its main competitors - the pound, the USD and the euro.

The focus of investors' attention remains the epidemiological situation in the country, which continues to be difficult. Prime Minister Fumio Kishida said today that the government will maintain the current strict restrictions on entry into the country until the end of February, although a number of exceptions may be made for humanitarian reasons. Currently, Japan has one of the strictest border regimes in the world, which prohibits residents from entering the country without Japanese citizenship, including foreign members of Japanese families and people permanently living in Japan. It is believed that this measure slows down the spread of the COVID-19 Omicron strain in the country. It also should be noted that according to the quarterly survey of the Bank of Japan, inflation expectations of Japanese households have risen to a two-year high. 78.8% of respondents expect prices to rise during the year, which gives investors hope that the Japanese regulator will still be able to push the inflation rate to the target level of 2.0%.​

Australia​

The Australian currency is weakening against the euro, the pound and the USD today, but is strengthening against the yen.

Australian economic data released today turned out to be controversial. Retail sales in November accelerated growth from 4.9% to 7.3%, which is higher than the 3.9% expected by investors. However, the positive effect of these data was offset by weak trade statistics. The volume of exports of Australian goods in November increased by 2.0%, and imports into the country increased by 6.0%, which led to a reduction in the trade surplus from 10.781 to 9.423B Australian dollars.

Oil
Oil quotes are trying to grow today.

Prices are rising due to the increasing optimism of investors. Market participants believe that the growth in oil demand will be maintained, since the governments of the leading consumer states are abandoning overly strict quarantine measures to curb the coronavirus pandemic caused by the Omicron strain. In addition, prices are supported by the slow increase in oil production by OPEC+ countries, which have not yet chosen their quotas, and interruptions in the supply of "black gold" from Libya. During the day, investors are waiting for the publication of a weekly report on the amount of oil reserves in the USA from API. Last time, the figure fell by 6,432M barrels. The continuation of the trend may give additional support to oil quotes.​
 

USD/JPY​

the market is waiting for the US inflation data​


Current trend
The US dollar is showing weak gains against the Japanese yen in Asian trading, trying to recover from a noticeable correction late last week.

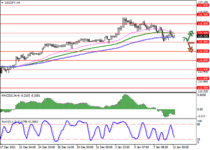
The instrument is testing 115.35 for a breakout; however, market activity remains subdued as investors await the publication of the updated US inflation statistics for December today. According to forecasts, the annual rate of growth in consumer prices could reach 7%, which will be an absolute record in the last 40 years. In turn, the US Fed is ready to raise interest rates, and the first adjustment in the coming year may take place already at the March meeting. The Fed's Chair Jerome Powell, speaking at the US Congress the day before, confirmed the regulator's readiness to prevent further entrenchment of inflation, which until recently was called a "temporary phenomenon".

Statistics from Japan released today has an ambiguous impact on the dynamics of the instrument. The Eco Watchers Survey on Current Situation in December rose slightly from 56.3 to 56.4 points, but the Survey on the Economic Outlook for the same period fell sharply from 53.4 to 49.4 points.

Support and resistance
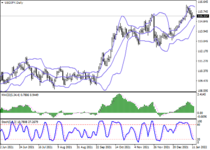
In the D1 chart, Bollinger Bands are reversing horizontally. The price range is narrowing, pointing at the multidirectional nature of trading in the short term. MACD is going down, keeping a fairly stable sell signal (located below the signal line). Stochastic keeps a confident downward direction but is rapidly approaching its lows, which indicates the oversold USD in the ultra-short term.

Resistance levels: 115.50, 116.00, 116.50, 117.00.
Support levels: 115.00, 114.50, 114.00, 113.50.​

usdjpy_analysis_1212022_1.pngusdjpy_analysis_1212022_2.png
 
Top