fatowl
Junior member
- Messages
- 33
- Likes
- 0
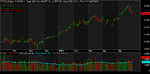
I have been backtesting and optimizing trading systems in Amibroker for 4 years now. One system is trading live and is profitable. One thing that I have always needed, but could never get easily, was information on how active a stock was over time. My trading system needs strong volume to trade otherwise I get big slippage.
Dollar-volume is a good metric to determine liquidity in a stock, but is a value of $10M traded during the day a high number or low number? Stocks like XOM have dollar-volumes near $1.3B! Clearly that's a very liquid stock. But what about in history? Back in 1965, XOM had a dollar-volume of only $1.3M (1000x less than today).
Well obviously, inflation and increased trading activity have pushed the dollar-volume up across the whole stock market from 1965 to 2013, but how am I to know what stocks are liquid or illiquid over time? Here is what I did:
I found a time series of the monthly dollar-volume of all stocks listed on the NYSE dating back to 1964:
NYSEData.com Factbook: NYSE Group Share and Dollar Volume in NYSE Listed
NYSEData.com Factbook: NYSE reported share and dollar volume
Using this as a rough guide for how much trading activity goes on over the course of history, I can determine what stocks are liquid or illiquid. The symbol I gave this series is #NYSEDV (NYSE Dollar-Volume). Any stock with a dollar-volume above:
#NYSEDV/100,000
was deemed "liquid". All others were deemed "illiquid". Today, #NYSEDV/100,000 is about equal to $7.8M. I'm working on creating another time series of the number of listed stocks per month on the NYSE. This way, I can just divide #NYSEDV by the number of stocks in each month to get an average monthly dollar-volume per stock.
Anyway, I was excited that I found this and thought you guys could benefit from it.