You are using an out of date browser. It may not display this or other websites correctly.
You should upgrade or use an alternative browser.
You should upgrade or use an alternative browser.
Nice reading
Stole this post from another board - good though 😈
"I took a glance at the 25 indexes on CS's Real Time Market Diary and clicked on the yearly view and assigned either bullish/bearish/or sideways patterns. Then I looked again at each one and finalized the results. You might find it interesting. Let me know what you think and if any questions, ok?
Results were as follow: Very Bullish - Amex oil.
Bullish - 7 (Dow Jones Composite, Trannys, Utilities, Nas Banks, Nas Financial, Gold, and Amex Xchg).
BEARISH - 3 (Computer, NMS Composite, Semi's)
All the rest were sideways (or neutral) formations.....
OEX - Sideways pattern.
Russ 2000 - Sideways pattern.
Nasdaq - Sideways.
Dow - Neutral.
Dow Jones Composite - Bullish formation.
Transportation - Bullish - leading the mkt upwards.
Utilities - Bullish pattern - leading the mkt upwards.
S&P - Sideways pattern.
Mid Cap 400 - Sideways pattern.
Nas Banks - Bullish pattern.
Nas Industrials - Sideways pattern.
Nas Insurance - Sideways pattern.
Nas Computer - Bearish pattern.
Nas Telecom - Sideways pattern.
Nas NMS Comp - Bearish pattern.
NDX - Sideways pattern.
Nas NMS Ind - Sideways pattern.
Nas Financial - Bullish pattern.
Amex Biotechs - Sideways pattern.
Internet Index - Sideways.
Semi's - Bearish pattern.
Val Line Arithmetic - Sideways pattern.
Gold - 6-mos pattern bullish.
Amex Oil - Very bullish pattern.
Amex Exchg - Bullish pattern."
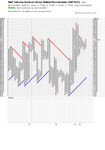
Sox & Xtc
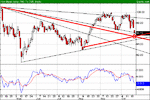
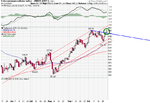
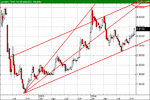
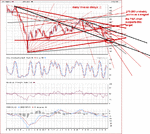
SOX trading the upper BB band!?
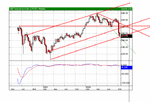
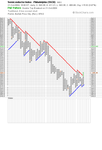
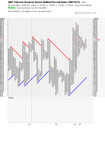
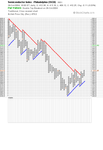
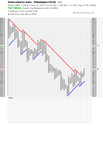
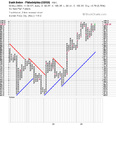
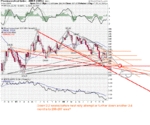
PF-chart had a break out - see if it lasts - I´m in doubt. XTC will probably get hammered after AT&T´s big loss yesterday & Ericsson´s disappointing outlook.
KLAC - the SOX-engine bullish. SMH (semiconduct holders) flat? Software & Internet looking bullish
http://data.island.com/ds/data/topl...dshares&order=asc&html=true&ah=false&rows=100
Attachments
Put/Call volume/value; Premium of EZ
Updated links
P/C-vol
http://ts-lc.sc8.finance.lycos.com/...aram2=26&Param3=9&FontSize=10&LocaleID=0x0409
P/C-value
http://ts-lc.sc8.finance.lycos.com/...aram2=26&Param3=9&FontSize=10&LocaleID=0x0409
CBOE todays volumes & ratios
http://www.cboe.com/data/IntraDayVol.aspx
Program buying (Premium)
Updated links
P/C-vol
http://ts-lc.sc8.finance.lycos.com/...aram2=26&Param3=9&FontSize=10&LocaleID=0x0409
P/C-value
http://ts-lc.sc8.finance.lycos.com/...aram2=26&Param3=9&FontSize=10&LocaleID=0x0409
CBOE todays volumes & ratios
http://www.cboe.com/data/IntraDayVol.aspx
Program buying (Premium)
Last edited:
XTC/SOX-rally starting next week?
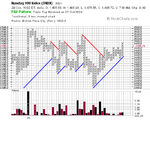
Time for technology; NDX100 bullish, lots of buy signals
Stock Scans (stockcharts)
Microchip world wide sales up!
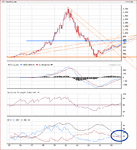
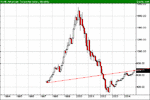
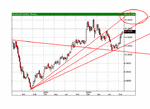
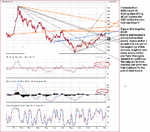
adding a 10y monhly chart on XTC - short term target 675-80 - in 6 months maybe 780 (???)
Time for technology; NDX100 bullish, lots of buy signals
Stock Scans (stockcharts)
Microchip world wide sales up!
adding a 10y monhly chart on XTC - short term target 675-80 - in 6 months maybe 780 (???)
Attachments
Last edited:
tradesmart
Experienced member
- Messages
- 1,286
- Likes
- 22
Very interesting and useful comments and charts Max.....!
(and in so many tradeable areas........!)
Keep up the good work......
Regards
(and in so many tradeable areas........!)
Keep up the good work......
Regards
tradesmart said:Very interesting and useful comments and charts Max.....!
(and in so many tradeable areas........!)
Keep up the good work......
Regards
Thanks! Just saw that Biotechs made a key reversal so not much for the bears at the moment. Very bullish sentiment as I see it. Things change! 😎
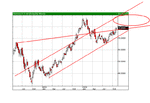
XTC giving a strong buy signal in the monthly chart.
Index page
Index page
Attachments
Last edited:
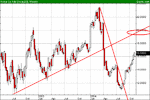
Drugs looks ugly -
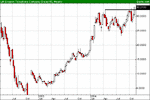
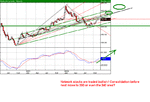
NWX Networking stocks are bullish
SOX - probably also bullish (haven´t looked at them but they usually trade in a similar pattern as NWX & XTC)
Guess we will see consolidation in bullish sectors and a dump of stocks in some until the OEX.
Then we might get a nice rally IMO.
NWX Networking stocks are bullish
SOX - probably also bullish (haven´t looked at them but they usually trade in a similar pattern as NWX & XTC)
Guess we will see consolidation in bullish sectors and a dump of stocks in some until the OEX.
Then we might get a nice rally IMO.
Attachments
Last edited:
Similar threads
- Replies
- 33
- Views
- 30K

