erierambler
Well-known member
- Messages
- 265
- Likes
- 8
dbphoenix said:(I do still use the AVDVd. As an "indicator", it's practically foolproof. But I more often look at the DV when nearing S and the AV when nearing R)
Something I will add, thanks.
erie
dbphoenix said:(I do still use the AVDVd. As an "indicator", it's practically foolproof. But I more often look at the DV when nearing S and the AV when nearing R)
erierambler said:No not at all. The adv-decl diff I keep in a spreadsheet, along with price and adv/decl issue statistics. (I also have a note that price diverged from the $XMI that day.)
erie
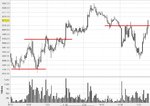
erierambler said:Potential resistance.
erie
dbphoenix said:But why 82.5? You have a series of three higher highs through that level. Is it just that price failed to hold above it?
erierambler said:Failed is the correct word. Price went below opening price after.(now I see why you would also put a line in at 1277.5, duh) And the low of 1272.5 would be potential support.
erie
dbphoenix said:Interesting. And all of this is confirmed later in the day on the 10th.
But that's later. So the ES opens at 78. Do you plan to go long if your 80.5 line is crossed and short if price drops below 78? Or do you sit back for a while to see where price finds S/R on the new day?
(One of the reasons I'm not comfortable with ES is that the S/R ranges can be so tight; that's why, in this case, I would have chosen 80.5 and 77.5, especially after the open.)
erierambler said:Well I would sit back and wait. Price found R at 1282 and S at 1272.5 , with most of the volume at 1276 (some at 1279-80).
erie
dbphoenix said:So rather than trade intraday, you're waiting for price to exceed the limits of the 7th, one way or the other?
erierambler said:Yes, that 's right. And on the next day I get stopped out.
erie
dbphoenix said:Yeah, that's why I prefer to daytrade the futures and "swing" trade the Q.
I take it you then shorted the bottom of the 11th?
erierambler said:If I was to look at your charts for the NQ, for the 7th , you would have R at 1560 and S at 1550?
erie
dbphoenix said:Do you have replay, by any chance?
erierambler said:Yes , I have Esignal , which has replay. Thanks for your explanation .
erie
dbphoenix said:Replay comes in real handy for testing and for practice. If you want to practice daytrading, go back to a week you don't remember, maybe mid-June or early May, and lay out your S/R lines for some Friday like you did on the chart you posted earlier. Then begin the replay on the following Monday. This will enable you to see how the S/R works out in real time. It will also enable you to plot new S/R as it comes up during the trading day (usually the first hour or so), such as I did with the charts I posted at the beginning of the thread.
dbphoenix said:Replay comes in real handy for testing and for practice. If you want to practice daytrading, go back to a week you don't remember, maybe mid-June or early May, and lay out your S/R lines for some Friday like you did on the chart you posted earlier. Then begin the replay on the following Monday. This will enable you to see how the S/R works out in real time. It will also enable you to plot new S/R as it comes up during the trading day (usually the first hour or so), such as I did with the charts I posted at the beginning of the thread.
firewalker99 said:So if I'm correctly, you wait the first hour to see where S/R finds it's way?
You don't look back at let's say yesterday, last week to draw previous S/R on today's chart?
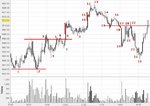
dbphoenix said:As an exercise in this, let's play a game. Do you see any significance to any of the points I've numbered in your chart? If so, explain what significance you see, by number (don't feel stupid if you see significance in only a few). If the significance seems too obvious to mention, go ahead and mention it. There aren't any trick questions.
Db