Road to disaster

Time to recap (before i through any more money down the drain)
after almost a month and 9 trades i'm up 190 pts win rate 44.4% risk reward at 1.91 (stats do not include break even trades)

although the results look promising they could have been a lot better, i feel that all of my losing trades could have been avoided. 3 impulse trades cost me 222 points and the other 2 should have been breakeven trades but i failed to move my stoploss costing me 141 points.

To combat this i've topped up to £1200 in order to trade 2 contracts stop loss will be set at 60 points giving me 5% risk per trade.

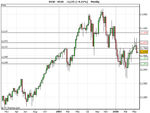
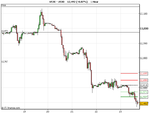
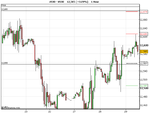
To clarify the strategy: I will be deciding on the most likely direction for the following week on a wed night/thursday morning, i will then place a trade to go long/short at a suitable support/resistance level on the hourly chart.

first contract will be closed at R1/S1 (pivot points) second at R2/S2.

stop will be moved to break even once an hourly bar clears my entry point (only time this will not happen is if i am at work when the trade goes live)

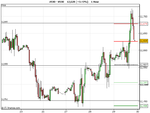
I am allowed to switch from long to short or vice cersa only in the following circumstances:

R2/S2 is hit or R1/S1 is hit and we have a reversal that breaks through the weeks high/low.

I am confident that if I stick to this plan my results will only get better although obviously i am aware that the data sample is very small and therefore meningless at present statisticly it is impossible to back test as my selection for long or short for the week is not mechanical.

I will be tracking the 2 contracts as seperate trades as my spread sheet does not allow me to enter multiple exit points for each trade and i would prefer to see how each method performs.
 
just clarify for me please, which Pivot points you use, monthly or weekly or daily, in which case would you keep revising your targets as the daily pivots change ?
 
I use the weekly pivots as generated by the cmc charts that i use each weekly bar runs from thurs-wed and i revise every week as they change.
 
Below is this weeks weekly chart. I'm bearish for the week but believe there will be a pull back to the pp @12768. This is far away enough to justify a long trade @12600. 60 pt sl at 12540. risk reward on this trade is 1:2.78.

I will be using the pivot point as my 1st objective and R1 as my secondary target.
 

Attachments

  • US30.png
    US30.png
    13 KB · Views: 183
stopped out on the long for a loss of 120 pts (2*60). I've got to get stricter with moving my sl to break even as there were 2 hourly bars that cleared my entry yesterday and i still decided to hold out. This was a terrible trading decision considering I my analysis for the week was bearish.

I will find it difficult to find a good entry for a short. With the market closed on monday I will probably sit out and wait for the new pivots next week.
 

Attachments

  • US30.png
    US30.png
    11 KB · Views: 176
looking for a short at 12670 bearish for the week.
 

Attachments

  • US30.png
    US30.png
    12.3 KB · Views: 191
close shave today, came within 10 pts of been stopped out. sl moved to break even now.
 

Attachments

  • US30.png
    US30.png
    11.9 KB · Views: 178
stopped out at be, orders in to go short at 12770 or 12555 whichever we hit first.
 
i've cancelled the short order at 12555, dont want to get filled on it only to get stopped out if we fill the gap
 
OK,

I know its been a while since I last updated but I've like an ex chelsea manager i've been tinkering and didnt want to post anything untill i was settled.

I took two weeks off work to look after my son and also to trade daily. It has been enjoyable and profitable and I uped the account to 12k and reduced the risk to 1% per trade.

Not been that happy at work I decided to take a career break and so therefore will be trading full time for the next 3 months, if all goes well i wont be going back, however my job is there for me for up to 5 years so long as i dont take another job elsewhere.

(I have my wifes blessing so thats half the battle won;) )

For this journal I will be posting my position summery at the end of each month, I was thinking of doing it daily but then it will start to feel like a chore I'm sure, I also believe that the mothly sumery will keep the journal shorter and show the 'bigger picture'

There has been a great deal of sceptism on these boards lately regarding the issue of been a profitable trader and do they really exist to the point that people are turning to spanish for tips!

I'm hopping that by showing all my trades in this way those in doubt will see that

A. It is possible to be profitable for longer then a day/week and

B. That the cost of my losing trades is much lower then the profit from my winners.

Having a stop loss 10x-20x greater then your profit target is sheer madness and does not work over the long run especially if that stop loss means you are risking 10%-20% of your account per trade.

The strategy will be more or less the same as it was before, hourly bars buy lows sell highs 40pt stop trading dow using pivots to help along the way. profit target is 120+.

win % is expected to remain in the 40s-50s although i am trying to improve this to 60%

I'm not going to go into any more details as the proof is in the pudding as they say so the monthly summery will tell the tale in a couple of weeks.

Happy trading all.
 
Ok so we have the first month in the bag.

Mixed results, I ended the month in the black but not by as much as I could have, Discipline or a lack of been major factor and fear been the other.

Lessons for july

Only trade your signals

Trade the same size the whole month.
 
I gave so much back, so not the best result but on the right track


MarkToMarket for US30 02-Jun-2008 300.00 CR 584.33 DR
MarkToMarket for US30 03-Jun-2008 770.00 CR 185.67 CR
MarkToMarket for US30 04-Jun-2008 610.00 CR 795.67 CR
MarkToMarket for US30 05-Jun-2008 300.00 DR 495.67 CR
MarkToMarket for US30 06-Jun-2008 300.00 DR 195.67 CR
MarkToMarket for US30 09-Jun-2008 170.00 CR 365.67 CR
MarkToMarket for US30 10-Jun-2008 1,470.00 CR 1,835.67 CR
MarkToMarket for US30 11-Jun-2008 880.00 DR 955.67 CR
MarkToMarket for US30 16-Jun-2008 800.00 DR 155.67 CR
MarkToMarket for US30 17-Jun-2008 400.00 DR 244.33 DR
MarkToMarket for US30 18-Jun-2008 1,410.00 CR 1,165.67 CR
MarkToMarket for +US30 19-Jun-2008 340.45 CR 1,506.12 CR
Financing Client Deducted on (60,315.45) USD 20/06/08 00:00 20-Jun-2008 8.11 DR 1,498.01 CR
MarkToMarket for US30 20-Jun-2008 1,215.45 DR 282.56 CR
MarkToMarket for US30 25-Jun-2008 465.85 CR 748.41 CR
MarkToMarket for +US30 26-Jun-2008 543.35 CR 1,291.76 CR
Financing Client Deducted on (114,534.20) USD 27/06/08 00:00 27-Jun-2008 15.81 DR 1,275.95 CR
MarkToMarket for US30 27-Jun-2008 64.20 DR 1,211.75 CR
MarkToMarket for US30 30-Jun-2008 55.00 DR 1,156.75 CR
CFwd 1,156.75 CR
 
This could get ugly

July was not a great month i was getting very few signals and the ones i was getting resulted in a loss, panic set in and i started deviating from the plan. This saw me go from 1k green for the month to 2k in the red by the end of the second week. i managed to reduce it to a £700 loss by the end but was still trading irratically.

The experience has taught me a lot about myself though and i spent the first week of august burying myself in my set up and asking myself some difficult questions in order to move it forward. In my search i came accross these two posts which i found usefall and so will share

http://www.trade2win.com/boards/396467-post2.html

http://www.trade2win.com/boards/379535-post72.html

I have come to realise that i have a need to be in the market the majority of the time that i am in front of the screen.

i also require a system that ends each week and most (if not all ) days in profit.

This is not achievable with a set up that only trades once a day at best so I have reduced my time frame from daily bars to hourly ones.

the main principle will remain the same using pivots for my trading decisions.

i will still trade the dow but will not start till 3pm gmt

trades are limited to 1 per hour win or lose
stop loss position at the moment is not giving a great r:r however i will record all trades including max drawdown on winners in order to establish a trend and hopefully tighten the stoploss.

I back tested manually on about 2 weeks worth of trades last week and 1 week in july and results looked promising.

However when i went live yesterday things were a bit trickyer and i suffered from sliipage.

This set up will most likely work best with a dma account and i am making enquiries into opening such an account.

For each trade i will be recording

Ideal entry
Actual entry
Stop loss
Profit target
Exit
Max drawdown (for winning trades and losers that would have come good)

My profit target for each day is 40+ compared to what i have shot for in the past this is very modest but it is all that i require in order to avoid going back to work on 1 contract and on two contracts or more i will be very happy.

My reasons for trading are not to get rich quick nor is it a requirenent to get rich slowly either, a modest income and escape from the rat race will keep me happy. I'm looking for about 3 trades per day so all done by 6pm.

I'll post yesterdays results next.
 
day 1, 1 contract

trade: 1
time: 15:01
Ideal entry: 11518
Actual entry: 11519
Stop loss: 11552
Profit target: 11479
Exit: 11552
P/L: (33pts)
Max drawdown: 57 pts

Trade: 2
time: 16:01
Ideal entry: 11561
Actual entry: 11555
Stop loss: 11585
Profit target: 11511
Exit: 11516
P/L: 39pts
Max drawdown: 0 pts

trade: 3
time: 17:02
Ideal entry: 11507
Actual entry: 11509
Stop loss: 11480
Profit target: 11541
Exit: 11542
P/L: 33 points
Max drawdown: 8 points

Notes:
Profit for the day 39 poits. i will reduce the stop loss to 20 points fixed for day 2 and see how that goes. the two winning trades had very little drawdown and if that continues to be the trend i may even reduce the stop the first trade was stopped out within 5 mins of opening it. For the two winners i was in the trade for the bulk of the hour.
 
Pivot Website

Hello Elefteros,

FWIW, I think you've got a good solid plan going.

I thought you might find this link interesting. He uses the convention of Monday-Friday Weekly Pivots, in case you still want to use them.

Lots of other things on there, including the daily pivots, Camarilla etc.

The link is to the e-mini Dow.

mini-sized Dow ($5) Futures Septemer 2008

Joey
 
Thanks for the link Joey, I'll go through it over the weekend. Today was a rough day for me 5 trades 3 of them losers 2 break even. glad i moved to a hard 20 point stop which limited losses to 63 points. I'm using the camarilla pivots worked out on the hourly bars buying/selling the first R2/S2 bounce and holding on to R4/S4 and beyond.

Today was not a good day to trade this way we ad no real retracements before continuing up wards and we had no red hourly bars.

I am considering adding a filter so that i only trade long or short on any given day, the result been i would only be buying S2 on long days and selling R2 on short days.

I am open to suggestions as to how to go about this, at the moment the only thing i have in mind is to look at the weekly bars and go long when above weekly pivot point and short when below.

I'll post todays trades separately but in hindsight they look a bit daft as they were all shorts.:eek:
 
Last edited:
day 2

Trade : 4 short
Time : 15:01
Ideal entry : 11506
Actual entry : 11509
Stop Loss : 11529
Profit target : 11428
Exit : 11529
P/L : (20)
Drawdown : na

Trade : 5 short
Time : 16:34
Ideal entry : 11641
Actual entry : 11639
Stop Loss : 11659
Profit target 11526
Exit : 11639
P/L : 0
Drawdown : 0

Trade : 6 short
Time : 18:04
Ideal entry : 11666
Actual entry : 11661
Stop Loss : 11681
Profit target : 11623
Exit : 11681
P/L : (20)
Drawdown : na

Trade : short
Time : 19:20
Ideal entry : 11730
Actual entry : 11726
Stop Loss : 11749
Profit target : 11665
Exit : 11749
P/L : (23)
Drawdown : 25 points

Trade : 8 short
Time : 20:01
Ideal entry : 11736
Actual entry : 11734
Stop Loss : 11754
Profit target : 11709
Exit : 11734
P/L : (0)
Drawdown : 13 points
 
Top